10-K: Annual report [Section 13 and 15(d), not S-K Item 405]
Published on November 20, 2025
UNITED STATES
SECURITIES AND EXCHANGE COMMISSION
Washington, D.C. 20549
_________________________________________________________
FORM 10-K
_________________________________________________________
(Mark One)
| ANNUAL REPORT PURSUANT TO SECTION 13 OR 15(d) OF THE SECURITIES EXCHANGE ACT OF 1934 | |||||
For the fiscal year ended September 30 , 2025
OR
| TRANSITION REPORT PURSUANT TO SECTION 13 OR 15(d) OF THE SECURITIES EXCHANGE ACT OF 1934 For the transition period from _______ to ________ | |||||
Commission File Number: 001-39030
_________________________________________________________
(Exact name of Registrant as specified in its Charter)
_________________________________________________________
| (State or other jurisdiction of incorporation or organization) | (I.R.S. Employer Identification No.) | ||||
| (Address of principal executive offices) | (Zip Code) | ||||
Registrant’s telephone number, including area code: (857 ) 362-7300
_________________________________________________________
Securities registered pursuant to Section 12(b) of the Act:
| Title of each class | Trading Symbol(s) | Name of each exchange on which registered | ||||||||||||
Securities registered pursuant to Section 12(g) of the Act: None
Indicate by check mark if the Registrant is a well-known seasoned issuer, as defined in Rule 405 of the Securities Act. Yes o No x
Indicate by check mark if the Registrant is not required to file reports pursuant to Section 13 or 15(d) of the Act. Yes o No x
Indicate by check mark whether the Registrant: (1) has filed all reports required to be filed by Section 13 or 15(d) of the Securities Exchange Act of 1934 during the preceding 12 months (or for such shorter period that the Registrant was required to file such reports), and (2) has been subject to such filing requirements for the past 90 days. Yes x No o
Indicate by check mark whether the Registrant has submitted electronically every Interactive Data File required to be submitted pursuant to Rule 405 of Regulation S-T (§232.405 of this chapter) during the preceding 12 months (or for such shorter period that the Registrant was required to submit such files). Yes x No o
Indicate by check mark whether the registrant is a large accelerated filer, an accelerated filer, a non-accelerated filer, a smaller reporting company, or an emerging growth company. See the definitions of “large accelerated filer,” “accelerated filer,” “smaller reporting company,” and “emerging growth company” in Rule 12b-2 of the Exchange Act.
| Large accelerated filer | o | x | ||||||||||||
| Non-accelerated filer | o | Smaller reporting company | ||||||||||||
| Emerging growth company | ||||||||||||||
If an emerging growth company, indicate by check mark if the registrant has elected not to use the extended transition period for complying with any new or revised financial accounting standards provided pursuant to Section 13(a) of the Exchange Act. o
Indicate by check mark whether the registrant has filed a report on and attestation to its management’s assessment of the effectiveness of its internal control over financial reporting under Section 404(b) of the Sarbanes-Oxley Act (15 U.S.C. 7262(b)) by the registered public accounting firm that prepared or issued its audit report. x
If securities are registered pursuant to Section 12(b) of the Act, indicate by check mark whether the financial statements of the registrant included in the filing reflect the correction of an error to previously issued financial statements.o
Indicate by check mark whether any of these error corrections are restatements that required a recovery analysis of incentive-based compensation received by any of the registrant's executive officers during the relevant recovery period pursuant to §240.10D-1(b). o
Indicate by check mark whether the Registrant is a shell company (as defined in Rule 12b-2 of the Act). YES o NO x
As of March 31, 2025, the aggregate market value of the registrant’s common stock held by non-affiliates of the registrant was approximately $340 million based on the closing price of the common stock on the Nasdaq Global Select Market for such date.
The number of shares of Registrant’s common stock outstanding as of November 7, 2025 was 44,938,757 .
DOCUMENTS INCORPORATED BY REFERENCE
Portions of the Registrant’s definitive Proxy Statement to be filed with the Securities and Exchange Commission in connection with the Registrant’s 2026 Annual Meeting of Stockholders are incorporated by reference into Part III of this Form 10-K. Such Proxy Statement will be filed within 120 days of the Registrant’s fiscal year ended September 30, 2025.
Table of Contents
| Page | ||||||||
i
CAUTIONARY STATEMENT CONCERNING FORWARD-LOOKING STATEMENTS
This Annual Report on Form 10-K (“Form 10-K”), filed by Cerence Inc. together with its consolidated subsidiaries, “Cerence,” the “Company,” “we,” “us” or “our” unless the context indicates otherwise, contains “forward-looking statements” that involve risks and uncertainties. These statements can be identified by the fact that they do not relate strictly to historical or current facts, but rather are based on current beliefs, expectations, anticipations, intentions, estimates, assumptions, plans and projections about our company, business, operations, industry and market trends, financial results, financial condition, strategy and plans, goals or prospects. Forward-looking statements often include words such as “anticipates,” “estimates,” “expects,” “projects,” “forecasts,” “intends,” “plans,” “continues,” “believes,” “may,” “will,” “could,” “goals,” “objectives” and words and terms of similar substance. Forward-looking statements in this Form 10-K include, among others, statements regarding our strategy, plans and goals, new products and innovation, industry and market trends, our ability to navigate the current macroeconomic environment, our future operating or financial performance or condition, backlog, cost savings initiatives, our ability to generate cash flow, our transition to a lower level of fixed contracts, liquidity, competition, litigation, and our prospects. As with any projection or forecast, forward-looking statements are inherently susceptible to uncertainty and changes in circumstances. Our actual results may vary materially from those expressed or implied in our forward-looking statements. Accordingly, undue reliance should not be placed on any forward-looking statement made by us or on our behalf.
Although we believe that the forward-looking statements contained in this Form 10-K are based on reasonable assumptions as of the date of this report, you should be aware that many factors could affect our actual financial results, financial condition or results of operations and could cause actual results to differ materially from those set forth in such forward-looking statements. Readers are directed to the risks and uncertainties identified below under “Risk Factor Summary,” “Risk Factors,” Management’s Discussion and Analysis of Financial Condition and Results of Operations” and elsewhere in this report for additional detail regarding factors that may cause actual results to be different than those expressed in these forward-looking statements. Such factors, among others, could cause actual results to differ materially from those contained in forward-looking statements made in this Form 10-K, in the documents incorporated by reference into this Form 10-K or presented elsewhere by our management from time to time. Even if our results of operations, financial condition and liquidity and the development of our business or the industry in which we operate are consistent with the forward-looking statements contained in this Form 10-K, those results or developments may not be indicative of results or developments in subsequent periods.
Any forward-looking statements made by us in this Form 10-K speak only as of the date on which they are made. We are under no obligation to, and expressly disclaim any obligation to, update or alter our forward-looking statements, whether as a result of new information, subsequent events or otherwise, except as required by law.
Risk Factor Summary
The following is a summary of the principal risks described below in Part I, Item 1A “Risk Factors” in this Form 10-K. We believe that the risks described in the “Risk Factors” section are material to investors, but other factors not presently known to us or that we currently believe are immaterial may also adversely affect us. The following summary should not be considered an exhaustive summary of the material risks facing us, and it should be read in conjunction with the “Risk Factors” section and the other information contained in this Form 10-K.
Risks Relating to Our Business
•The market in which we operate is highly competitive and rapidly changing and we may be unable to compete successfully.
•Adverse conditions in the automotive industry or the global economy more generally could have adverse effects on our results of operations.
•Our process optimization and cost-reduction efforts may not be successful.
•Our strategy to increase cloud connected services may adversely affect our near-term revenue growth and results of operations.
•Pricing pressures from our customers may adversely affect our business.
•We invest effort and money seeking validation of our technology by original equipment manufacturers (“OEMs”), and there can be no assurance that we will win or be able to renew service contracts.
•Our business could be materially and adversely affected if we lost any of our largest customers.
1
•Our operating results may fluctuate significantly from period to period, and this may cause our stock price to decline.
•We may not be successful with the adoption of new products.
•We may be unable to attract and retain management and other key personnel.
•We depend on skilled employees and could be impacted by a shortage of critical skills.
•Some of our employees are represented by workers councils or unions or are subject to local laws that are less favorable to employers than the laws of the U.S.
•Cybersecurity and data privacy incidents or breaches may damage client relations and inhibit our growth.
•Compliance with global privacy and data security requirements could result in additional costs and liabilities to us or inhibit our ability to collect and process data globally, and the failure to comply with such requirements could have a material adverse effect on our business, financial condition or results of operations.
•The development and use of artificial intelligence AI (“AI”) presents risks and challenges that can impact our business including by posing security risks to our confidential information, proprietary information, and personal data and could give rise to legal and/or regulatory actions, damage our reputation or otherwise materially harm our business.
•A significant portion of our revenues and research and development activities originate outside the United States. Our results could be harmed by economic, political and regulatory risks associated with these international regions and foreign currency fluctuations.
•Our business in China is subject to aggressive competition and is sensitive to economic, market and political conditions.
•Interruptions or delays in our services or services from data center hosting facilities or public clouds could impair the delivery of our services and harm our business.
•If our goodwill or other intangible assets become impaired, our operating results could be negatively impacted.
•Public health events, such as pandemics or disease outbreaks, have disrupted, and may in the future disrupt, our business, which could adversely affect our financial performance.
Risks Relating to our Intellectual Property and Technology
•Third parties have claimed and may claim in the future that we are infringing their intellectual property, and we could be exposed to significant litigation or licensing expenses or be prevented from selling our products if such claims are successful.
•Unauthorized use of our proprietary technology and intellectual property could adversely affect our business and results of operations.
•Our software products may have bugs, which could result in delayed or lost revenue, expensive correction, liability to our customers and claims against us.
•We may be unable to respond quickly enough to changes in technology and technological risks and to develop our intellectual property into commercially viable products.
•We utilize certain key technologies, content and services from, and integrate certain of our solutions with, third parties and may be unable to replace those technologies, content and services if they become obsolete, unavailable or incompatible with our solutions.
Risks Relating to the Spin-Off
•The allocation of intellectual property rights and data between Nuance and Cerence as part of the Spin-Off, could adversely impact our reputation, our ability to enforce certain intellectual property rights, and our competitive position.
2
Risks Relating to Our Securities and Indebtedness
•We may evaluate whether to pay cash dividends on our common stock in the future.
•Servicing our debt may require a significant amount of cash. We may not have sufficient cash flow from our business to pay our indebtedness.
•The conditional conversion feature of the 2028 Notes, if triggered, may adversely affect our financial condition and results of operations and the value of our common stock.
•The accounting method for convertible debt securities that may be settled in cash, such as the 2028 Notes, could have a material effect on our reported financial results.
•Certain provisions in our organizational documents, including amendments thereto, and Delaware law may discourage takeovers.
•Our organizational documents, including amendments thereto, designate the courts of the State of Delaware or the U.S. district courts as the sole and exclusive forum for certain types of proceedings, which could limit our stockholders’ ability to obtain a favorable judicial forum for disputes.
General Risk Factors
•Tax matters may cause significant variability in our financial results and may impact our overall financial condition.
•The commercial and credit environment may adversely affect our access to, and the cost of, capital.
•Our stock price may fluctuate significantly.
•Your percentage ownership in Cerence may be diluted in the future.
•If we fail to maintain proper and effective internal controls, our ability to produce accurate and timely financial statements could be impaired and investors’ views of us could be harmed.
3
PART I
Item 1. Business.
Overview
Cerence builds conversational and agentic AI solutions that make interaction with technology feel effortless. With decades of expertise in voice, AI, and edge-to-cloud engineering, we’re trusted by many of the world’s leading automakers, transportation OEMs, consumer brands, and technology companies to build voice powered-interfaces that shape the user experiences of today and tomorrow. While the majority of our business is in the automotive market, our solutions can be leveraged across other areas of transportation - two-wheeled vehicles, trucks, and more - as well as outside of automotive - televisions, smart watches, voice-powered kiosks, and more.
Our automotive customers include nearly all major automobile original equipment manufacturers (OEMs) worldwide, including BMW, Mercedes-Benz, the Volkswagen Group (Volkswagen, Audi, Porsche, and other brands), Stellantis, Renault, Toyota, Ford, General Motors, BYD, Great Wall Motor, and NIO. We also partner with leading tier-one suppliers including HARMAN, EcarX, Bosch, Continental, Denso Ten, Aptiv, and others. We deliver our solutions on a white-label basis, enabling our customers to deliver highly customized virtual assistants with unique, branded personalities that strengthen the bond between their brands and end users.
Fast-moving technological advancements and increasing user engagement and comfort with large language models are driving automakers to examine how they can quickly and cost-effectively bring expanded AI features into their cars. To meet the increasing demand for automotive cognitive assistance and to offer differentiated in-car experiences, OEMs and suppliers are building proprietary virtual assistants into their vehicles. We believe that this trend will continue and that consumer adoption of in-car AI will continue to grow.
Cerence is a market leader for building integrated, branded and differentiated virtual assistants for automobiles, offering an extensive solutions portfolio that includes conversational & generative AI as well as audio & communications AI. Our conversational and generative AI solutions include a full-stack generative AI-based voice assistant, including voice activation, natural voice input and output, and hybrid conversational services for automotive and general-purpose tasks. Our audio and communications AI solutions include best-in-class audio applications, enhancing in-car experiences by reducing environmental noise and enabling seamless interaction with vehicles, inside and out. Our solutions are comprised of both edge computing and cloud-connected software components and a software framework linking these components together under a common programming interface. We deploy these solutions in deep partnership with OEMs and suppliers to optimize our software for the requirements, configurations and acoustic characteristics of specific vehicle models.
We generate revenue primarily by selling software licenses and cloud-connected services. In addition, we generate professional services revenue from our work with OEMs and suppliers during the design, development, and deployment phases of the vehicle model lifecycle and through maintenance and enhancement projects. Over our more than 25 years in the automotive industry, we have developed longstanding industry relationships. We have existing relationships with nearly all major OEMs or their tier 1 suppliers, and while our customer contracts vary, they generally represent multi-year engagements, giving us visibility into future revenue. We have master agreements or similar commercial arrangements in place with many of our customers, supporting customer retention over the long term.
As of September 30, 2025, we had estimated five-year remaining performance obligations of approximately $165.2 million. As of September 30, 2025, we had variable five-year backlog of approximately $1,004.0 million, which includes estimated future revenue from variable forecasted royalties related to our embedded, connected, and professional services businesses. Our estimate of forecasted royalties is based on our royalty rates for embedded and connected technologies from expected car shipments under our existing contracts over the term of the programs. Expected shipments are based on historical shipping experience, customer projections, and other information that management believes, taken collectively, provide a reasonable basis for estimating future shipments as of the date of this Form 10-K. Both our embedded and connected technologies are largely priced and sold on a per-vehicle or device basis, where we receive a single fee for either or both the embedded license and the connected service term. However, our five-year remaining performance obligations and variable five-year backlog may not be indicative of our actual future revenue. The revenue we actually recognize is uncertain and subject to numerous factors, including the number and timing of vehicles our customers ship, potential terminations or changes in scope of customer contracts, and currency fluctuations, as well as the other risks discussed below in Item IA, “Risk Factors.” As of September 30, 2025, we estimate our five-year backlog to be approximately $1,169.2 million, including $165.2 million of five-year remaining performance obligations and $1,004.0 million of five-year variable backlog. As of September 30, 2024, the estimated five-year backlog was approximately
4
$952.7 million, including $172.7 million of five-year remaining performance obligations and $780.0 million of five-year variable backlog.
Our solutions have shipped in more than 525 million automobiles to date, including over 25 million new vehicles in fiscal year 2025 alone. Based on royalty reports provided by our customers and third-party reports of total vehicle production worldwide, we estimate that approximately 52% of all cars shipped during the fiscal year ended September 30, 2025 included Cerence technologies. Cerence hybrid solutions shipped on approximately 15.4 million vehicles during the fiscal year ended September 30, 2025. In aggregate, over 80 OEMs and Tier 1 suppliers worldwide use our solutions, covering over 70 languages and dialects, including English, German, Spanish, French, Mandarin, Cantonese, Japanese and Hindi.
In fiscal year 2025, we generated revenue of $251.8 million, a decrease of 24% compared to $331.5 million for the fiscal year ended September 30, 2024. We recorded net loss of $18.7 million for the fiscal year ended September 30, 2025, a change of 97% compared to net loss of $588.1 million recorded for the fiscal year ended September 30, 2024. The financial information included herein may not necessarily reflect our results of operations in the future.
History and Corporate Information
On October 1, 2019, Nuance Communications, a leading provider of speech and language solutions for businesses and consumers around the world, completed the legal and structural separation and distribution to its stockholders of all of the outstanding shares of our common stock, and its consolidated subsidiaries, in a tax free spin-off (the“Spin-Off”). On October 2, 2019, our common stock began regular-way trading on the Nasdaq Global Select Market under the ticker symbol CRNC.
Our principal executive offices are located at 25 Mall Road, Suite 416, Burlington, Massachusetts 01803 and our telephone number at that address is (857) 362-7300. Our website is www.cerence.com. We are not including the information contained in our website as part of, or incorporating it by reference into, this Form 10-K. We make available free of charge through our website our annual reports on Form 10-K, quarterly reports on Form 10-Q, current reports on Form 8-K and amendments to these reports, as soon as reasonably practicable after we electronically file these materials with, or otherwise furnish them to, the Securities and Exchange Commission, or the SEC. The SEC maintains a website (www.sec.gov) that contains reports, proxy and information statements, and other information regarding issuers that file electronically with the SEC.
We webcast our earnings calls and certain events we participate in or host with members of the investment community on the investor relations page of our website (https://investors.cerence.com/). Additionally, we provide notifications of news or announcements regarding our financial performance, investor events, and press and earnings releases as part of our investor relations website. We intend to use our investor relations website as a means of disclosing material non-public information and for complying with our disclosure obligations under Regulation FD. The information contained in our website is not included as part of, or incorporated by reference into, this Form 10-K or in any other document we file with the SEC, and any references to our website are intended to be inactive textual references only.
Our Technology & Capabilities
Our mission is to create the world’s most compelling, immersive experience across transportation and beyond, for today and tomorrow. We deliver automotive cognitive assistance solutions that are conversational and intuitive and that enable OEMs to strengthen their connection with their end users through a distinct, consistent, branded experience. Our solutions portfolio, developed in deep partnership with the automotive industry and designed to improve the in-car experience for drivers and passengers worldwide, includes, but is not limited to, the following:
•Conversational and Generative AI: Our AI-powered UX platforms include Cerence xUI, our customizable, hybrid generative AI platform built on our CaLLM family of large and small language models, and Cerence Assistant, our ready-to-deploy, next-gen voice assistant. These offerings are supported by our core technologies, including assistant activation, precise speech recognition and lifelike text-to-speech that create natural, intuitive voice experiences.
•Audio AI: a set of advanced, flexible and scalable speech enhancement and signal processing solutions tailored for modern voice assistants, voice communication applications and acoustic event detection.
5

How it Works
User engagement with Cerence-powered virtual assistants typically begins with a voice request. Upon receiving such an input, our software platform determines what the user has said, infers user intent, and maps the request to the most applicable category and domain or agent. Depending on the applicable domain, our software platform determines whether to respond directly or access an external or third-party data source, in all cases resulting in a response including spoken words and/or taking action. Depending on the complexity of the request and other factors, engagement may consist of multiple rapid voice interactions with the user and may combine assistance in multiple domains or across multiple AI agents.
Our software platform offers a hybrid architecture combining edge software components, which are embedded in a vehicle’s head unit and integrated with onboard systems, with cloud-connected components, which access data and content on external networks and support over-the-air updates. This hybrid architecture enables our software platform to combine the performance, reliability, efficiency, security and tight vehicular integration of embedded software with the flexibility and intelligence that cloud connectivity provides. Response frameworks can generally be customized such that requests are processed first at the edge, controlling cloud transmission costs, or in parallel at the edge and in the cloud, to achieve higher confidence responses with low latency. Our software platform includes a common programming framework including toolkits and applications for its edge and cloud-connected components, and our customers can choose the software components that are necessary to power the experiences that they want to build and offer.
We typically sell our edge software components under a traditional per unit perpetual software license model, in which a per unit fee is charged for each software instance installed on an automotive head unit. Our customers generally provide estimates of the units to be shipped for a particular program, and we review third-party market studies and work with our customers to refine and understand these projections. While these projections provide us with some reasonable visibility into future revenue, the number of units to be shipped for a particular program is not committed upfront.
We offer cloud-connected components in the form of a connected service to the vehicle end user. Initial subscriptions typically have multi-year terms from the time of a vehicle’s sale and are paid in advance by the OEM or supplier. Renewal options vary and are managed by our customers on behalf of vehicle end users.
Professional Services
We have a large professional services team that works with our customers in the design, development and deployment phases of a vehicle head unit program and vehicle model lifecycle, as well as in maintenance and enhancement engagements. Our professional services team is globally distributed to serve our customers in their primary design and production jurisdictions. We typically charge manufacturers for our design and consulting work, which are primarily project-based, in line with customary non-recurring engineering industry practices.
6
Our Competitive Strengths
Our key competitive strengths include:
•Industry-leading technology and expansive language portfolio. Fast-moving technological advancements and increasing user engagement with large language model (LLM)-powered assistant platforms are driving automakers to examine how they can quickly and cost-effectively bring expanded AI features into their cars. Cerence xUI™ delivers on this need, offering an agentic, automotive-specific voice assistant platform that leverages our CaLLM™ family of cloud and embedded large and small language models; third-party LLMs and agents; real-time data sources; and contextual data from the car to create an engaging, conversational interface that can complete tasks, answer questions, and entertain users. Underscoring our deep expertise at the intersection of AI innovation and the unique requirements of the automotive user experience, we have already signed several strategic, long-term partnership agreements as well as proof-of-concept programs with global automakers to deploy Cerence xUI as the basis for their future in-cabin experiences. In addition to our core platform innovation, we believe that our portfolio of over 70 languages represent an important competitive advantage, as the development of capabilities to support a new language is expensive and time-consuming. Importantly, our offerings are backed by our portfolio of patents and associated rights.
•Hybrid edge-cloud system architecture. Our platforms' hybrid architecture combines the performance, reliability and tight integration that only edge software can provide with the flexibility of cloud connectivity. Cloud-reliant solutions with which our software platform competes cannot match edge software’s low latency, bandwidth efficiency, or availability in the absence of network connectivity. At the same time, cloud connectivity provides rich knowledge and content, improving the end user experience, and - depending on the OEM's particular capabilities - enables automakers to deploy new and advanced capabilities not only to new cars, but to cars already on the road , delivering added value to their drivers even after vehicle purchase. With our unique expertise in hybrid AI, we deliver an optimal interplay between the edge and cloud, reducing connectivity requirements and data privacy concerns while also leveraging real-time data and advanced AI reasoning.
•Platform Flexibility. With cross-platform compatibility and hardware flexibility, we empower OEMs to adapt quickly, reduce complexity, and deploy bespoke in-car assistants across different vehicle platforms and SOCs. We work with a variety of partners - NVIDIA, Arm, SiMa.AI, and others - to deliver an agnostic approach that meets OEMs where they are and fits into their budget and technology requirements. This helps OEMs avoid being locked into a singular architecture and helps future-proof their platforms in an age of rapid innovation and ever-changing consumer needs.
•Independence from large technology companies and automobile industry players. The in-car experience is more central to the overall driving experience than ever. Branded, differentiated automotive cognitive assistants are thus increasingly important to OEMs’ brand value. As a neutral, independent, white-label software platform vendor, we empower our customers to build branded and differentiated experiences and retain ownership of, or rights to, their system design and data.
•Deep expertise working with OEMs and tier 1 suppliers. The design and development of the head unit within the vehicle ecosystem is a complex process requiring tight integration of the software and hardware components used in and with the vehicle. Having partnered with the world's leading OEMs and suppliers for over 25 years to design and integrate our solutions into their cars, we have a unique understanding of their needs, product roadmaps and global go-to-market strategies. Further, we are fully operational and production ready for the start-to-finish execution of automotive programs. This gives us credibility with OEMs as we seek new business or look to grow our existing business.
7
Our Growth Strategies
We believe our growth opportunity has three key facets: continued investment in expanding the capabilities of our solutions portfolio, delivering new functionality to our installed base, and expansion beyond automotive. We believe that successful execution of these key objectives could lead to the greater penetration of our offerings and key enabling technologies throughout our target markets, resulting in an increase in the revenue we are able to capture per vehicle and expansion of our market share relative to competitors. Our primary growth strategies include, but are not limited to, the following:
•Maintain and extend product leadership. We intend to continue investing in developing our solutions portfolio, especially continuing to expand the capabilities of Cerence xUI, our next-gen platform, with a particular view toward maintaining our market share in edge software components and growing our share in cloud-connected software functionalities. Our existing relationship with, and our proximity in the design process to, OEMs provides us with insight into the needs of end-users and roadmaps for innovation. Additionally, we intend to continue to invest in customizing and supporting our solutions for specific individual automobile vehicle models, resulting in tight integration of our solutions. We believe that increasing complexity of our edge software components, including with respect to language models and multi-modal interaction, and growth in our cloud-connected product areas, including the enabling of third-party services, will enable us to increase the revenue per vehicle that we are able to generate. Additionally, we believe that these investments will help maintain our position with existing customers through new vehicle models and enable us to grow with the overall market for automotive cognitive assistance.
•Deliver new functionality to existing installed base. Our solutions have shipped in more than 525 million vehicles to date. Depending on system capabilities, we have an opportunity to deliver updated functionality to end users in the form of embedded software upgrades performed by dealers and over-the-air updates delivered from the cloud.
•Expand into non-automotive markets. Today, we primarily target the automobile and broader transportation market. However, our products and technology also have application to other areas, including, but not limited to, televisions, consumer devices like smart watches, voice-powered kiosks, and industrial applications. We have early progress in some of these areas and see this as a growth opportunity moving forward.
Competition
The automotive cognitive assistance market is competitive. Today, we face competition from three types of organizations:
•Large technology companies. Many large technology companies, including Amazon, Apple, Google, Microsoft, Alibaba, Baidu and Tencent, offer Internet-based virtual assistants. Given the popularity in general of these virtual assistants, we believe that automobile drivers and riders increasingly desire the ability to use them as part of the mobility experience. To meet this demand, some of these companies have invested in technologies, such as Apple CarPlay, to make their virtual assistants more accessible within vehicle cabins.
While these third-party virtual assistants directly compete with some of the functionality we provide as part of our software platform, they also increase the need for our software platform in two ways. First, given the fragmented and competitive nature of the virtual assistant market, it is important for OEMs and suppliers to enable end users to utilize a variety of virtual assistants. The flexibility of our platforms can, dependent on appropriate third-party agreements, enable OEMs and suppliers to provide access to multiple third-party virtual assistants through a consistent, branded interface. Second, the noisy environment of a vehicle cabin presents significant speech processing challenges for smartphone-based third-party virtual assistants that are not designed for a specific vehicle model. Our software platform integrates with third-party virtual assistants and improves their functionality by improving the quality of speech input.
•OEMs. In the age of the software-defined vehicle, OEMs are increasingly committed to building their own internal software hubs and areas of expertise. This may give our customers a viable
8
alternative to our products and our competitors' products as OEMs consider the potential value of developing and deploying competitive solutions by investing in their own capabilities.
While this may be a viable alternative to our products and services in some instances, we anticipate that their ability to develop competitive technology may not be widely successful given their relative inexperience, leading some of their customers to choose alternative product offerings. With our extensive experience developing attractive solutions for a global automotive market, we believe that our pace of development and deep understanding of the needs of OEMs and their customers will continue to demonstrate the value of bringing Cerence in as an innovation partner. As such, even if OEMs attempt to develop the technology on their own, they may still opt for us at the end of the day.
•Small, focused competitors. We compete for business directly with certain companies focused on voice-based virtual assistance, including SoundHound in the U.S., iFlyTek in China, and other regional and technology-focused competitors. These companies have had some success selling into our customer base. However, we believe that we have multiple meaningful competitive advantages, including our scale, our globally distributed team, our best-in-class portfolio of compatible languages, and our deep experience and focus on the automotive market. We also believe that our technology, particularly our speech signal enhancement and acoustic tuning, is superior based on benchmarking results against our competitors. We believe we will continue to be able to compete successfully against these competitors as we continue to invest in our offerings.
Our industry has attracted, and may continue to attract, new entrants. Although we find that OEMs often prefer to maintain relationships with suppliers that have a proven record of performance, they also rigorously reevaluate suppliers on the basis of product quality, price, reliability and timeliness of delivery, product design capability, technical expertise and development capability, new product innovation, financial viability, operational flexibility, customer service and overall management.
Research and Development
We maintain technical engineering centers in major regions of the world that help develop our software platforms and their underlying components and provide our customers with local engineering capabilities and design development.
We employ approximately 700 research and development personnel around the world, including scientists, engineers and technicians. Our total research and development expenses were approximately $97.8 million, $121.6 million and $123.3 million for fiscal years 2025, 2024 and 2023, respectively.
We believe that continued investment in research and development will be critical for us to continue to deliver market-leading, AI-powered solutions. Accordingly, we intend to continue to invest in our product portfolio and allocate available capital and resources to our growth opportunities.
Customers
Our customers include nearly all major OEMs or their tier 1 suppliers worldwide. Our automobile manufacturer customers, commonly referred to as OEMs, include BMW, Mercedes-Benz, the Volkswagen Group (Volkswagen, Audi, Porsche, and other brands), Stellantis, Renault, Toyota, Ford, General Motors, BYD, Great Wall Motor, NIO, and many others and represented approximately 50% of our revenue in fiscal year 2025. Our tier 1 supplier customers, who typically sell automobile components to the OEMs, include HARMAN, EcarX, Bosch, Continental, Denso Ten, Aptiv, and many others and represented approximately 50% of our revenue in fiscal year 2025.
Our revenue base is geographically diverse. In fiscal year 2025, approximately 16%, 42% and 42% of our revenue came from the Americas, Europe and Asia, respectively.
Sales and Marketing and Professional Services
We market our offerings using a high-touch model in which we sell directly to our customers, which include OEMs and suppliers and as described above under “Customers.” For each of our customers, we assign a cross-functional team to support development and deployment. Our customer contracts are bespoke and vary widely, but
9
generally represent multi-year agreements providing visibility into future revenue and helping to support retention of customer relationships over the long term.
Our sales and marketing team includes sales representatives, account managers, sales engineers, product managers, and marketing experts. As we sell our offerings to nearly all major OEMs or their tier one suppliers today, our sales strategy is primarily focused on leveraging our existing customer relationships. Account managers typically have longstanding relationships with specific customers and are distributed worldwide to provide local customer coverage. We often utilize trade shows, customer-specific demo days, and proof-of-concept programs (“POCs”) to showcase our technology and capabilities to OEMs and tier one suppliers on an individual basis. These events help maintain our market presence and awareness of our platform’s offerings while also providing opportunities to solicit feedback and input from our customers on our roadmap and future technologies.
Our professional services organization includes approximately 300 employees. These employees work with our customers in the design phase of the vehicle lifecycle to tailor our platform for specific requirements such as branding and also tune the software for the characteristics of a specific vehicle model or models. Our professional services team also provides post-design phase services through maintenance engagements, particularly with respect to our cloud-connected solutions. The tight integration of our platform into our customers’ design process and their vehicles supports our ability to win future business with those customers. Like our sales representatives, our professional services employees often have longstanding relationships with specific customers and are distributed worldwide to provide local customer coverage.
Human Capital
Summary
In September of 2025, we announced a restructuring plan (the "2025 Plan") intended to reduce operating expenses and position us for profitable growth, which included plans for a reduction in force and the closure of an office facility. The implementation of the 2025 Plan is expected to be substantially complete by the end of the first quarter of fiscal year 2026. The charges that we incur are subject to a number of assumptions, including legal requirements in impacted jurisdictions.
In August 2024, we announced a restructuring plan (the "2024 Plan") intended to reduce operating expenses and position us for profitable growth, which included a reduction in force. The implementation of the 2024 Plan was substantially complete by the end of the first quarter of fiscal year 2025.
As of September 30, 2025, we had approximately 1,300 full-time employees, with approximately 300 in professional services, and approximately 700 in research and development. Approximately 93% of our employees are based outside of the United States. None of our employees in the United States are represented by a labor union; however many of our employees in Europe are represented by workers councils or labor unions. Due to the planned closing of one of our facilities as part of the 2025 Plan, we have experienced minimal work stoppages of 12 hours.
Culture and Work Environment
We are a group of highly motivated collaborators who share a common passion for creating meaningful change in our industry and shaping the future of mobility. We are committed to attracting and retaining the best and brightest talent and building a culture of transparency, trust, and respect that has its foundation in our core values: Innovate Always, Delight Customers, Grow Together, and Have Fun.
We proactively nurture our culture by investing in our people, processes and professional development. We understand our people are critical for our continued success and are focused on helping our employees grow at every stage of their careers. To help employees at every level develop professional skills to advance in their careers, we offer employee and manager development training. Through regular seminars and workshops, our people learn diverse skills that include leveraging AI, leadership, negotiating, communicating, goal setting, and more. We provide access to world-class continuing education opportunities and resources including on-demand, self-paced learning opportunities via LinkedIn Learning.
Our teams are also continuously connecting through local social events, which bring teams together while promoting engagement, inclusion, and community-service. Our social committees organize numerous events including luncheons, karaoke, archery, yoga, hiking, fun runs, and community cleanup days. We also encourage employees to serve the community by offering compensated volunteer days to employees. In fiscal year 2025, we contributed approximately 500 community service hours globally.
10
Compensation, Rewards and Benefits
In addition to competitive base salaries, we provide incentive-based compensation programs to reward performance relative to key metrics. We offer comprehensive benefit options, including retirement savings plans, medical insurance, dental insurance, vision insurance, life and disability insurance, health savings accounts, flexible spending accounts, and paid time off, among others.
Intellectual Property
As of September 30, 2025, we own 832 patents and patent applications and other intellectual property. Prior to our Spin-Off from Nuance, we entered into an Intellectual Property Agreement, which provides us with certain non-exclusive rights with respect to patents that will continue to be held by Nuance. While no individual patent or group of patents, taken alone, is considered material to our business, in the aggregate, we believe that these patents and rights provide meaningful protection for our products, technologies, and technical innovations.
Item 1A. Risk Factors.
You should carefully consider all of the information in this Form 10-K and each of the risks described below, which we believe are the material risks that we face. Some of the risks relate to our business, others to our intellectual property and technology, the securities markets, our indebtedness and ownership of our securities. Any of the following risks could materially and adversely affect our business, financial condition and results of operations and the actual outcome of matters as to which forward-looking statements are made in this Form 10-K.
Risks Relating to Our Business
The market in which we operate is highly competitive and rapidly changing and we may be unable to compete successfully.
There are a number of companies that develop or may develop products that compete in the automotive voice assistance market. The market for our products and services is characterized by intense competition, evolving industry and regulatory standards, emerging business and distribution models, disruptive software technology developments, short product and service life cycles, price sensitivity on the part of customers, and frequent new product introductions, including alternatives for certain of our products that offer limited functionality at significantly lower costs or free of charge. In addition, some of our competitors have business objectives that may drive them to sell their alternative offerings at a significant discount to our offerings in the automotive voice assistant market. Current and potential competitors have established, or may establish, cooperative relationships among themselves or with third parties to increase the ability of their technologies to address the needs of our prospective customers. Furthermore, existing or prospective customers may decide to develop competing products or have established, or may in the future establish, strategic relationships with our competitors. Alternatively, given the increased availability and effectiveness of AI technologies and other open-source development tools, existing or prospective customers may decide to develop competitive solutions entirely in-house which compete with our product offerings. We also face significant competition with respect to cloud-based solutions in the automotive cognitive assistance market where existing and new competitors may have or have already established significant market share and product offerings.
The competition in the automotive cognitive assistance market has and could adversely affect in the future, our operating results by reducing the volume of the products and solutions we license or sell or the prices we can charge. Some of our current or potential competitors are large technology companies that have significantly greater financial, technical and marketing resources than we do, and others are smaller specialized companies that possess automotive expertise or regional focus and may have greater price flexibility than we do. These competitors may be able to respond more rapidly than we can to new or emerging technologies or changes in customer requirements or may decide to offer products at low or unsustainable cost to win new business. They may also devote greater resources to the development, promotion and sale of their products than we do, and in certain cases may be able to include or combine their competitive products or technologies with other of their products or technologies in a manner whereby the competitive functionality is available at lower cost or free of charge within the larger offering. To the extent they do so, penetration of our products, and therefore our revenue, may be adversely affected. Our large competitors may also have greater access to data, including customer data, which provides them with a competitive advantage in developing new products and technologies. Our success depends substantially upon our ability to enhance our products and technologies, to develop and introduce, on a timely and cost-effective basis, new products and features that meet changing customer requirements and incorporate technological enhancements, and to maintain our alignment with the OEMs, their technology and market strategies. If we are unable to develop new products and enhance functionalities or technologies to adapt to these changes and maintain our alignment with OEMs, our business will suffer.
11
Adverse conditions in the automotive industry or the global economy more generally could have adverse effects on our results of operations.
Our business depends on, and is directly affected by, the global automotive industry. Automotive production and sales are highly cyclical and depend on general economic conditions and other factors, including consumer spending and preferences, changes in interest rate levels and credit availability, consumer confidence, fuel costs, fuel availability, environmental impact, governmental incentives and regulatory requirements, trade restrictions, customs regulations, tariffs and price or exchange controls, preferences by nations for domestically manufactured products and political volatility, especially in energy-producing countries and large or high growth markets. Such factors have in the past and may in the future also negatively impact consumer demand for automobiles that include features such as our products. In addition, automotive production and sales can be affected by our customers’ ability to continue operating in response to challenging economic conditions, and in response to labor relations issues, regulatory requirements, trade agreements and other factors. For example, the U.S. government and governments of other countries recently adopted tariffs that apply to the automotive industry and may affect the business of our customers, which in turn could impact our own business. In addition, U.S. trade legislation continues to evolve related to barriers on the use of various products and technology from around the world including but not limited to the Securing the Information and Communications Technology and Services Supply Chain: Connected Vehicles regulation promulgated by the U.S. Department of Commerce in December 2024. The Company can provide no assurance that any strategies we implement to mitigate the impact of any trade actions will be successful. The volume of global automotive production has fluctuated, sometimes significantly, from year to year, and such fluctuations give rise to fluctuations in the demand for our products. Any significant adverse change in any of these factors, including, but not limited to, general economic conditions and the resulting bankruptcy of a customer, the closure of a customer manufacturing facility or the ability of a customer manufacturing facility to obtain supplies to manufacture automobiles and to ship or receive shipments of parts, supplies or finished product on prices that are acceptable to them, or imposition of tariffs that affect the prices at which end consumers purchase automobiles, may result in a reduction in automotive sales and production by our customers, and could have a material adverse effect on our business, results of operations and financial condition.
In the past couple of years, we have observed increased economic uncertainty in the United States and abroad. Impacts of such economic weakness include:
•falling overall demand for goods and services, leading to reduced profitability;
•reduced credit availability;
•higher borrowing costs;
•reduced liquidity;
•recession risks;
•volatility in credit, equity and foreign exchange markets; and
•bankruptcies.
Events involving limited liquidity, defaults, non-performance or other adverse developments that affect financial institutions or the financial services industry generally, have in the past and may in the future lead to market-wide liquidity problems. If banks or financial institutions where we maintain deposits enter receivership or become insolvent in the future in response to financial conditions affecting the banking system and financial markets, then our ability to access our cash and cash equivalents may be threatened and could have a material adverse effect on our business and financial condition. In addition, if any of our customers, suppliers or other parties with whom we conduct business are unable to access funds pursuant to such instruments or lending arrangements with such a financial institution, such parties’ ability to pay their obligations to us or to enter into new commercial arrangements requiring additional payments to us could be adversely affected.
These developments, along with continued uncertainty about tariffs and trade policies, and the ongoing conflicts in Ukraine and the Middle East, have resulted in supply chain disruption, inflation, higher interest rates, fluctuations in currency exchange rates, and uncertainty about business continuity, which may adversely affect our business and our results of operations. As our customers react to global political, trade and economic conditions and the potential for a global recession, we may see them increase pricing pressure on us, reduce spending on our products and take additional precautionary measures to limit or delay expenditures and preserve capital and liquidity. Reductions in spending on our solutions, delays in automobile production or purchasing decisions, lack of renewals or the inability to attract new customers, as well as pressure for extended billing terms or pricing discounts, would limit our ability to grow our business and negatively affect our operating results and financial condition.
12
Our process optimization and cost-reduction efforts may not be successful.
From time to time, we take actions focused on process optimization and reducing operational costs. For instance, in September 2025, we announced the 2025 Plan with respect to certain foreign operations intended to streamline certain operations and simplify our organizational structure. Similarly, in August 2024, we announced the 2024 Plan intended to reduce operating expenses and position us for profitable growth, which plan was substantially complete by the end of the first quarter of fiscal year 2025. The implementation of these types of plans may be disruptive to our operations, result in higher than anticipated restructuring charges, including severance payments, payments in lieu of notice, employee benefits and related costs, and otherwise adversely affect our results of operations and financial condition. Additional risks associated with the continuing impact of these plans include employee attrition, the ability to hire new employees in the future, diversion of management attention, and adverse effects on employee morale.
In addition, our ability to complete the 2025 Plan or any plan we may announce in the future and achieve the anticipated benefits from such plan within the expected time frame, or at all, is subject to management’s estimates and assumptions and may vary materially from our expectations, including as a result of factors that are beyond our control. If we do not realize the expected benefits of the 2025 Plan or any plan we may announce in the future on a timely basis, or at all, our business, results of operations and financial condition could be adversely affected. Furthermore, following completion of the 2025 Plan or any plan we may announce in the future, our business may not be more efficient or effective than prior to the implementation of such plan. Our failure to successfully control our expenses could materially impact our results of operations, financial condition and cash flows.
Our strategy to increase cloud connected services may adversely affect our near-term revenue growth and results of operations.
Our leadership position has historically been derived from our products and services based on edge software technology. We have been and are continuing to develop new products and services that incorporate cloud-connected components. The design and development of new cloud-connected components will involve significant expense. Our research and development costs have increased in recent years and, together with certain expenses associated with delivering our connected services, could continue to escalate in the near future. We may encounter difficulties with designing, developing and releasing new cloud-connected components, as well as integrating these components with our existing hybrid technologies. These development issues may further increase costs and may affect our ability to innovate in a manner demanded by the market. As a result, our strategy to incorporate more cloud-connected components may adversely affect our revenue growth and results of operations.
Pricing pressures from our customers may adversely affect our business.
We have in the past, and may in the future, experience pricing pressure from our customers, including from the strong purchasing power of major OEMs. As a developer of automotive cognitive assistance components, we have been in the past, and may be in the future, expected to quote fixed prices or be forced to accept prices with annual price reduction commitments for long-term sales arrangements or discounted reimbursements for our work. We have in the past, and may in the future, encounter customers unwilling to accept the terms of our software license or non-recurring engineering agreements. Any price reductions could impact our sales and profit margins. Our future profitability will depend upon, among other things, our ability to continuously reduce the costs for our components and maintain our cost structure. Our profitability is also influenced by our success in designing and marketing technological improvements in automotive cognitive assistance systems. If we are unable to offset any price reductions in the future, our business, results of operations and financial condition would be adversely affected.
We invest effort and money seeking OEMs’ validation of our technology, and there can be no assurance that we will win or be able to renew service contracts, which could adversely affect our future business, results of operations and financial condition.
We invest effort and money from the time an OEM or a tier 1 supplier begins designing for an upcoming program to the date on which the customer chooses our technology to be incorporated directly or indirectly into one or more specific vehicle models to be produced by the customer. This selection process is known as a “design win.” We could expend our resources without success, and in the past we have not always been selected despite the investment of effort and money. After a design win, it is typically quite difficult for a product or technology that did not receive the design win to displace the winner until the customer begins a new selection process because it is very unlikely that a customer will change complex technology until a vehicle model is revamped. In addition, the company with the winning design may have an advantage with the customer going forward because of the established relationship between the winning company and such customer, which could make it more difficult for such company’s competitors to win the designs for other service
13
contracts. Even if we have an established relationship with a customer, any failure to perform under a service contract or innovate in response to their feedback may neutralize our advantage with that customer. If we fail to win a significant number of customer design competitions in the future or to renew a significant number of existing service contracts, our business, results of operations and financial condition would be adversely affected. The period of time from winning a contract to implementation is long and we are subject to the risks of cancellation or postponement of the contract or unsuccessful implementation. If we are unable to renew existing service contracts, deferred revenue may be negatively impacted.
Our products are technologically complex and incorporate many technological innovations. The increasing complexity of software in automobiles has created substantial challenges for some OEMs, leading to potential delays for a new program to launch. Moreover, prospective customers generally must make significant commitments of resources to test and validate our products before including them in any particular vehicle model. The development cycles of our products with new customers are approximately six months to two years after a design win, depending on the customer and the complexity of the product. These development cycles result in us investing our resources prior to realizing any revenues from the customer contracts. Further, we are subject to the risk that a customer cancels or postpones implementation of our technology, as well as the risk that we will not be able to implement our technology successfully. Further, our sales could be less than forecast if the vehicle model is unsuccessful, including reasons unrelated to our technology. Long development cycles and product cancellations or postponements may adversely affect our business, results of operations and financial condition.
Our business could be materially and adversely affected if we lost any of our largest customers.
The loss of business from any of our major customers, including as a result of lower overall demand for vehicles, automotive production curtailment or delays, cancellation of existing contracts or the failure to award us new business, has in the past and could in the future have a material adverse effect on our business, results of operations and financial condition. Alternatively, there is a risk that one or more of our major customers could be unable to pay our invoices as they become due or that a customer will simply refuse to make such payments given its financial difficulties. If a major customer becomes subject to bankruptcy or similar proceedings whereby contractual commitments are subject to stay of execution and the possibility of legal or other modification, or if a major customer otherwise successfully procures protection against us legally enforcing its obligations, it is likely that we will be forced to record a substantial loss. In addition, certain of our customers that are tier 1 suppliers exclusively sell to certain OEMs, including some of our other customers. A bankruptcy of, or other significant disruption to, any of these OEMs could intensify any adverse impact on our business and results of operations.
Our operating results may fluctuate significantly from period to period, and this may cause our stock price to decline.
Our revenue and operating results may fluctuate materially in the future. These fluctuations may cause our results of operations to not meet the expectations of securities analysts or investors which would likely cause the price of our stock to decline. Factors that may contribute to fluctuations in operating results include:
•given our limited customer base, the volume, timing and fulfillment of large customer contracts;
•renewals of existing customer contracts and wins of new customer programs;
•changes in customer forecasts;
•our mix of variable, fixed prepaid or fixed minimum purchase commitment license contracts;
•increased expenditures incurred pursuing new product or market opportunities;
•the timing of the receipt and accuracy of royalty reports;
•fluctuating sales by our customers to their end-users;
•level of professional services projects;
•contractual counterparties failing to meet their contractual commitments to us;
•introduction of new products by us or our competitors;
•cybersecurity or data breaches;
14
•reduction in the prices of our products in response to competition, market conditions or contractual obligations;
•impairment of goodwill or intangible assets;
•accounts receivable that are not collectible;
•higher than anticipated costs related to fixed-price contracts with our customers;
•change in costs and demand for our products due to tariffs, or regulatory or trade restrictions;
•expenses incurred in litigation matters, whether initiated by us or brought by third-parties against us, and settlements or judgments we are required to pay in connection with disputes;
•changes in our stock compensation practices, as it relates to employee incentive payments; and
•general economic trends as they affect the customer bases into which we sell.
Due to the foregoing factors, among others, our financial and operating results may fluctuate significantly from period to period. Our expense levels are based in significant part on our expectations of future revenue, and we may not be able to reduce our expenses quickly to respond to near-term shortfalls in projected revenue. Therefore, our failure to meet revenue expectations would seriously harm our operating results, financial condition and cash flows.
We may not be successful with the adoption of new products.
Part of our growth strategy includes the successful introduction of new products that will rely on subscription or transactional-based revenue generation. These represent new applications and we cannot assure the introduction of these new products, the level of adoption of these new products, or how quickly they can ramp to generate meaningful revenue. The development and launch of new products will require maintaining adequate resources, such as the appropriate personnel and technology to develop such products. We may experience delays between the time we incur expenses associated with the development and launch of new products and the revenue generated from the products. In addition, anticipated demand for the new products could decrease after we have spent time and resources on the development of the new product, or our efforts may not lead to the successful introduction of new products that are competitive, which would harm our business, results of operations and financial condition.
If we are unable to attract and retain management and other key personnel, our business could be harmed.
If any of our management or other key employees were to leave, we could face substantial difficulty in hiring qualified successors and could experience a loss in productivity while any successor obtains the necessary training and experience. Although we have arrangements with some of our executive officers designed to promote retention, our employment relationships are generally at-will and we have had management and other key employees leave in the past. We cannot assure you that one or more management or other key employees will not leave in the future. The departure of key leadership personnel, in particular, can take significant knowledge and experience from the Company. While this loss of knowledge and experience can be mitigated through a successful transition, there can be no assurance that we will be successful in such efforts. If we do not successfully manage the transition of management positions, it could be viewed negatively by our customers, employees or investors and could have an adverse impact on our business and strategic direction. A change in senior management, such as we experienced over the past few years, also could result in our future strategy and plans differing from those of the past. In August 2024 and September 2025, we announced restructuring plans, including reductions in force, intended to reduce operating expenses and position us for profitable growth. These reductions and any additional measures we might take to reduce costs could yield unanticipated consequences, such as straining our workforce, diverting management attention, yielding attrition beyond our intended workforce reduction, or reducing employee morale. Further, we intend to continue to hire additional highly qualified personnel, including research and development and operational personnel, but may not be able to attract, assimilate or retain qualified personnel in the future. Any failure to attract, integrate, motivate and retain these employees could harm our business.
We depend on skilled employees and could be impacted by a shortage of critical skills.
Much of our future success depends on the continued service and availability of skilled employees, particularly with respect to technical areas. Skilled and experienced personnel in the areas where we compete are in high demand, and competition for their talents is intense. We expect that many of our key employees will receive a total compensation package that includes equity awards. We are limited in the amount of equity awards that we may issue under the terms of our equity incentive plans. Further, new regulations or volatility in the stock market could diminish our use,
15
and the value, of our equity awards. These issues could place us at a competitive disadvantage in attracting qualified personnel or force us to offer more cash compensation.
Some of our employees are represented by workers councils or unions or are subject to local laws that are less favorable to employers than the laws of the U.S.
Most of our employees in Europe are represented by workers councils or unions. Although we believe we have a good working relationship with our employees and their legal representatives, they must approve any changes in terms which may impede efforts to restructure our workforce.
Cybersecurity and data privacy incidents or breaches may damage client relations and inhibit our growth.
The confidentiality and security of our information, and that of third parties, is critical to our business. In particular, our services involve the transmission, use, and storage of customers’ and their customers’ information, which may be confidential or contain personally identifiable information. Our internal computer systems and those of our current or future service providers, contractors and consultants are vulnerable to damage from computer viruses, unauthorized access, natural disasters, terrorism, war and telecommunication and electrical failures. Attacks on information technology systems are increasing in their frequency, levels of persistence, sophistication and intensity, and they are being conducted by increasingly sophisticated and organized groups and individuals with a wide range of motives and expertise. The prevalent use of mobile devices also increases the risk of data security incidents.
While we maintain a broad array of information security and privacy measures, policies and practices, our networks may be breached through a variety of means, resulting in someone obtaining unauthorized access to our information, to information of our customers or their customers, or to our intellectual property; disabling or degrading service; or sabotaging systems or information. In addition, hardware, software, systems, or applications we develop or procure from third parties may contain defects in design or manufacture or other problems that could unexpectedly compromise information security. Unauthorized parties may also attempt to gain access to our systems or facilities, or those of third parties with whom we do business, through fraud or other forms of deceiving our employees, contractors, and vendors. Because the techniques used to obtain unauthorized access, or to sabotage systems, change frequently and generally are not recognized until launched against a target, we may be unable to anticipate these techniques or to implement adequate preventative measures.
While we have not experienced any material system failure, accident or security breach to date, if such an event were to occur and cause interruptions in our operations or the operations of third-party service providers, contractors and consultants, it could result in significant reputational, financial, legal, regulatory, business or operational harm. Any cybersecurity or data privacy incident or breach may result in:
•loss of revenue resulting from the operational disruption;
•loss of revenue or increased credit loss expense due to the inability to invoice properly or to customer dissatisfaction resulting in collection issues;
•loss of revenue due to loss of customers;
•material remediation costs to recreate or restore systems;
•material investments in new or enhanced systems in order to enhance our information security posture;
•cost of incentives offered to customers to restore confidence and maintain business relationships;
•reputational damage resulting in the failure to retain or attract customers;
•costs associated with potential litigation or governmental investigations, enforcement actions or regulatory fines;
•claims by third parties asserting that we have breached our privacy, confidentiality, data security or similar obligations;
•costs associated with any required notices of a data breach;
•costs associated with the potential loss of critical business data;
•difficulties enhancing or creating new products due to loss of data or data integrity issues; and
16
•other consequences of which we are not currently aware of but will discover through the remediation process.
In addition, our liability insurance may not be sufficient in type or amount to cover us against claims related to security breaches, cyberattacks and other related breaches. While we expect to continue to incur significant costs to continuously enhance our information security measures to defend against the threat of cybercrime, there can be no assurance that such measures will successfully prevent service interruptions, data security incidents and other security breaches. Any cybersecurity or data privacy incidents could have a material adverse effect on our business, results of operations and financial condition.
Compliance with global privacy and data security requirements could result in additional costs and liabilities to us or inhibit our ability to collect and process data globally, and the failure to comply with such requirements could have a material adverse effect on our business, financial condition or results of operations.
Privacy and data security have become significant issues in the U.S., Europe and in many other jurisdictions where we conduct or may in the future conduct our operations. The regulatory framework for the collection, use, safeguarding, sharing and transfer of information worldwide is rapidly evolving and is likely to remain uncertain for the foreseeable future. Globally, virtually every jurisdiction in which we operate has established its own data security and privacy frameworks with which we must comply.
Notably, for example, on May 25, 2018, the European General Data Protection Regulation 2016/679, which is commonly referred to as GDPR, took effect. The GDPR applies to any company established in the European Economic Area (“EEA”) as well as any company outside the EEA that collects or otherwise processes personal data in connection with the offering of goods or services to individuals in the EEA or the monitoring of their behavior. The GDPR enhances data protection obligations for processors and controllers of personal data, including providing information to individuals regarding data processing activities, implementing safeguards to protect the security and confidentiality of personal data, providing notification of data breaches, requirements to conduct data protection impact assessments and taking certain measures when engaging third-party processors. The GDPR imposes additional obligations and risk upon our business and substantially increases the penalties to which we could be subject in the event of any non-compliance. Failure to comply with the requirements of the GDPR may result in potential fines. The GDPR also confers a private right of action on data subjects and nonprofit organizations, acting subject to a mandate granted by the data subject, to lodge complaints with supervisory authorities, seek judicial remedies, and obtain compensation for damages resulting from violations of the GDPR.
Further, European data protection laws also prohibit the transfer of personal data from the EEA and Switzerland to third countries that are not considered to provide adequate protections for personal data, including the U.S., unless certain measures are in place. The European Commission has issued standard contractual clauses for data transfers from controllers or processors in the EU (or otherwise subject to the GDPR) to controllers or processors established outside the EU. The new standard contractual clauses require exporters to assess the risk of a data transfer on a case-by-case basis, including an analysis of the laws in the destination country. Further, the EU and United States have adopted its adequacy decision for the EU-U.S. Data Privacy Framework ("Framework"), which entered into force on July 11, 2023. This Framework provides that the protection of personal data transferred between the EU and the United States is comparable to that offered in the EU. This provides a further avenue to ensuring transfers to the United States are carried out in line with GDPR. There has been an extension to the Framework to cover Swiss transfers to the United States. The Framework could be challenged like its predecessor frameworks. This complexity and the additional contractual burden increase our overall risk exposure. There may be further divergence in the future, including with regard to administrative burdens.
In addition, we are subject to Swiss data protection laws, including the Federal Act on Data Protection, or the FADP. While the FADP provides broad protections to personal data, on September 25, 2020, the Swiss federal Parliament enacted a revised version of the FADP, which became effective September 1, 2023. The new version of the FADP aligns Swiss data protection law with the GDPR.
Further, in addition to existing European data protection law, a further European Union regulation is being proposed. The proposed regulation, known as the Regulation on Privacy and Electronic Communications, or ePrivacy Regulation, would replace the current ePrivacy Directive. New rules related to the ePrivacy Regulation are likely to include enhanced consent requirements in order to use communications content and communications metadata, as well as obligations and restrictions on the processing of data from an end-user’s terminal equipment. The new ePrivacy Regulation is expected to have the same penalty regime as the GDPR. Negotiations for the ePrivacy Regulation are still ongoing as of the date of this report, and there is no final text or date for entry into force. Once agreed, the ePrivacy Regulation will come into force in two years from the twentieth day following its publication.
17
As another prominent example, we are also subject to data protection regulation in the UK. Following the UK’s withdrawal from the EU on January 31, 2020 and the end of the transitional arrangements agreed between the UK and EU as of January 1, 2021, the GDPR has been incorporated into UK domestic law. United Kingdom-based organizations doing business in the European Union will need to continue to comply with the GDPR. Although the UK is regarded as a third country under the EU’s GDPR, the European Commission recognizes the UK as providing adequate protection under the EU GDPR and, therefore, transfers of personal data originating in the EU to the UK remain unrestricted. Like the EU GDPR, the UK GDPR restricts personal data transfers outside the UK to countries not regarded by the UK as providing adequate protection. The UK government has confirmed that personal data transfers from the UK to the EEA remain free flowing. The Information Commissioner’s Office, or ICO, has recently introduced new mechanisms for international transfers of personal data originating from the UK (an International Data Transfer Agreement, or IDTA, along with a separate addendum to the EU SCCs). There has also been an extension to the Framework to cover UK transfers to the United States. We will be required to implement these new safeguards when conducting restricted cross-border data transfers and doing so will require significant effort and cost.
In addition to European data protection requirements, we face a growing body of privacy and data security requirements in the United States. At the legislative level, the CCPA, which became operative on January 1, 2020 and broadly defines personal information, gives California residents expanded privacy rights and protections, and provides for civil penalties for violations and a private right of action for data breaches. Additionally, the CPRA, a ballot initiative approved in November 2020, which went into effect on January 1, 2023 significantly modified the CCPA, including by expanding consumers’ rights and establishing a new state agency that has authority to implement and enforce the CCPA. Numerous other states have passed comparable legislation and many others are considering proposals for similar broad consumer privacy laws. Moreover, other states have enacted privacy laws with a more limited scope, such as the state of Washington which has enacted legislation that is focused on health privacy and a small number of states have enacted laws that target biometric privacy. Furthermore, the United States Federal Trade Commission and many state attorney generals are interpreting existing federal and state consumer protection laws as imposing standards for the online collection, use, dissemination, and security of data.
The regulatory framework governing the collection, processing, storage, use and sharing of certain information, particularly financial and other personal data, is rapidly evolving and is likely to continue to be subject to uncertainty and varying interpretations. In addition to new and strengthened laws and regulations in the U.S., European Union, and United Kingdom, many foreign jurisdictions have passed new laws, strengthened existing laws, or are contemplating new laws regulating personal data. For example, we are subject to stringent privacy and data protection requirements in many countries including Singapore and Japan. Additional jurisdictions with stringent data protection laws include Brazil and China. We also continue to see jurisdictions, such as Russia, imposing data localization laws, which under Russian laws require personal information of Russian citizens to be, among other data processing operations, initially collected, stored, and modified in Russia.
Preparing for and complying with the evolving application of these laws has required and will continue to require us to incur substantial operational costs and may interfere with our intended business activities, inhibit our ability to expand into certain markets or prohibit us from continuing to offer services in those markets without significant additional costs. It is possible that these laws may impose, or may be interpreted and applied to impose, requirements that are inconsistent with our existing data management practices or the features of our services and platform capabilities. Any failure or perceived failure by us, or any third parties with which we do business, to comply with our posted privacy policies, changing consumer expectations, evolving laws, rules and regulations, industry standards, or contractual obligations to which we or such third parties are or may become subject, may result in actions or other claims against us by governmental entities or private actors, the expenditure of substantial costs, time and other resources, may cause our customers to lose confidence in our solutions, harm our reputation, expose us to litigation, regulatory investigations and resulting liabilities including reimbursement of customer costs, damages, penalties or fines imposed by regulatory agencies; and require us to incur significant expenses for remediation.
The development and use of artificial intelligence (“AI”) presents risks and challenges that can impact our business including by posing security risks to our confidential information, proprietary information, and personal data and could give rise to legal and/or regulatory actions, damage our reputation or otherwise materially harm our business.
We develop and incorporate AI technology in certain of our products and services and plan to develop and incorporate additional AI technology in future products and services. Issues in the development and use of AI, including generative AI tools and large language models, combined with an uncertain regulatory environment, may result in reputational harm, liability, or other adverse consequences to our business operations. AI presents risks, challenges, and unintended consequences that could affect our and our customers’ adoption and use of this technology. AI algorithms and training methodologies may be flawed. Additionally, AI technologies are complex and rapidly evolving, and we face
18
significant competition in the market and from other companies regarding such technologies. Our vendors may incorporate generative AI tools into their offerings without disclosing this use to us, and the providers of these generative AI tools may not meet existing or rapidly evolving regulatory or industry standards with respect to privacy and data protection and may inhibit our or our vendors’ ability to maintain an adequate level of service and experience. If we, our vendors, or our third-party partners experience an actual or perceived breach of privacy or security incident because of the use of AI, we may lose valuable intellectual property and confidential information and our reputation and the public perception of the effectiveness of our security measures could be harmed. Further, bad actors around the world use increasingly sophisticated methods, including the use of AI, to engage in illegal activities involving the theft and misuse of personal information, confidential information, and intellectual property.
On the regulatory front, recent state legislative developments in the United States have introduced emerging compliance risks for companies that develop or deploy AI technologies. Certain states, such as Texas, California and Colorado have enacted legislation which imposes or will impose novel requirements on AI developers and users. We do not expect these legislative acts to present a material risk to us individually, given the nature of our operations and the locations in which we conduct business. However, these state-level initiatives reflect a growing trend toward AI regulation in the absence of federal legislation. As a result, we may face a fragmented and evolving compliance landscape that could increase operational complexity, regulatory scrutiny, and legal exposure associated with our use or development of AI technologies. While we aim to develop and use AI responsibly and attempt to identify and mitigate ethical and legal issues presented by its use, we may be unsuccessful in identifying or resolving issues before they arise. AI-related issues, deficiencies and/or failures could:
•give rise to legal and/or regulatory actions, including with respect to legislation regulating AI in jurisdictions such as the EEA, and as a result of new applications of existing data protection, privacy, intellectual property, and other laws;
•damage our reputation; or
•otherwise materially harm our business.
In addition, we generate professional services revenue from our work with customers during the design, development and deployment phases of the vehicle model lifecycle and through maintenance and enhancement projects. As our professional services offerings become more standardized across our customer base, we may observe less revenues due to decreased integration time required. In addition, the use of AI technologies, or other increasingly pervasive open source development tools, by our customers to accomplish these tasks internally could have a negative impact on our business and the revenues that we derive from the provision of professional services.
A significant portion of our revenues are derived, and a significant portion of our research and development activities are based, outside the United States. Our results could be harmed by economic, political, and regulatory risks associated with these international regions and foreign currency fluctuations.
Because we operate worldwide, our business is subject to risks associated with doing business internationally. We generate most of our international revenue in Europe and Asia, and we anticipate that revenue from international operations will increase in the future. In addition, some of our products are developed outside the United States. We conduct a significant portion of the development of our voice recognition and natural language understanding solutions in Canada and Germany. We also have significant research and development resources in Belgium, China, India, Italy, and the United Kingdom. We are exposed to fluctuating exchange rates of foreign currencies, including the euro, British pound, Canadian dollar, Chinese RMB, Japanese yen, Indian rupee and South Korean won. Accordingly, our future results could be harmed by a variety of factors associated with international sales and operations, including:
•adverse political and economic conditions, or changes to such conditions, in a specific region or country;
•trade protection measures, including tariffs and import/export controls, imposed by the United States and/or by other countries or regional authorities such as China, Canada or the European Union;
•changes in foreign currency exchange rates or the lack of ability to hedge certain foreign currencies;
19
•compliance with laws and regulations in many countries, including with respect to data protection, anticorruption, labor relations, tax, foreign currency, anti-competition, import, export and trade regulations, and any subsequent changes in such laws and regulations;
•geopolitical turmoil, including terrorism and war, such as the ongoing conflicts in Ukraine and the Middle East;
•changing data privacy regulations and customer requirements to locate data centers in certain jurisdictions;
•evolving restrictions on cross-border investment, including recent enhancements to the oversight by the Committee on Foreign Investment in the United States pursuant to the Foreign Investment Risk Preview Modernization Act and substantial restrictions on investment from China;
•changes in applicable tax laws;
•difficulties in staffing and managing operations in multiple locations in many countries;
•longer payment cycles of foreign customers and timing of collections in foreign jurisdictions; and
•less effective protection of intellectual property than in the United States.
Our business in China is subject to aggressive competition and is sensitive to economic, market and political conditions.
We operate in the highly competitive automotive cognitive assistance market in China and face competition from both international and smaller domestic manufacturers. We anticipate that additional competitors, both domestic and international, may seek to enter the Chinese market resulting in increased competition. Increased competition may result in price reductions, reduced margins and our inability to gain or hold market share. There have been periods of increased market volatility and moderation in the levels of economic growth in China, which resulted in periods of lower automotive production growth rates in China than those previously experienced. In addition, political tensions between China and the United States may negatively impact our ability to conduct business in China. If we are unable to grow or maintain our position in the Chinese market, the pace of growth slows or vehicle sales in China decrease, our business, results of operations and financial condition could be materially adversely affected. Government regulations and business considerations may also require us to conduct business in China through joint ventures with Chinese companies. Our participation in joint ventures would limit our control over Chinese operations and may expose our proprietary technologies to misappropriation by joint venture partners. The above risks, if realized, could have a material adverse effect on our business, results of operations and financial condition.
Interruptions or delays in our services or services from data center hosting facilities or public clouds could impair the delivery of our services and harm our business.
Because our services are complex and incorporate a variety of third-party hardware and software, our services may have errors or defects that could result in unanticipated downtime for our customers and harm to our reputation and our business. We have from time to time, found defects in our services, and new errors in our services may be detected in the future. In addition, we currently serve our customers from data center hosting facilities or third-party public clouds we directly manage. Any damage to, or failure of, the systems and facilities that serve our customers in whole or in part could result in interruptions in our service. Interruptions in our service may reduce our revenue, cause us to issue credits or pay service level agreement penalties, cause customers to terminate their on-demand services, and adversely affect our renewal rates and our ability to attract new customers.
If our goodwill or other intangible assets become impaired, our operating results could be negatively impacted.
We have significant intangible assets, including goodwill and other intangible assets, which are susceptible to valuation adjustments as a result of changes in various factors or conditions. The most significant intangible assets are goodwill, customer relationships and patents and core technologies. Customer relationships are amortized over their estimated economic lives based on the pattern of economic benefits expected to be generated from the use of the asset. Technologies and patents are amortized on a straight-line basis over their estimated useful lives. We assess the potential impairment of goodwill on an annual basis. Whenever events or changes in circumstances indicate that the carrying value may not be recoverable, we will be required to assess the potential impairment of goodwill and other intangible assets. Factors that could trigger an impairment of such assets include the following:
20
•changes in our organization or management reporting structure that could result in additional reporting units, which may require alternative methods of estimating fair values or greater disaggregation or aggregation in our analysis by reporting unit;
•significant under performance relative to historical or projected future operating results;
•significant changes in the strategy for our overall business;
•significant negative industry or economic trends;
•significant decline in our stock price for a sustained period; and
•our market capitalization declining to below net book value.
During the fiscal years ended September 30, 2025 and 2023, we did not have goodwill impairment. For the fiscal year ended September 30, 2024, we recorded a goodwill impairment charge of $609.2 million within the Consolidated Statement of Operations.
Future adverse changes in the above or other unforeseeable factors could result in additional impairment charges that would impact our results of operations and financial position in the reporting period identified.
Health Events, such as pandemics and disease outbreaks, have disrupted, and may continue to disrupt, our business and that of our customers, which could adversely affect our financial performance.
Our business depends on, and is directly affected by, the output and sales of the global automotive industry and the use of automobiles by consumers. Health events, such as pandemics and disease outbreaks, have disrupted, and may in the future again disrupt, global automotive industry sales and production volumes. As a result of such events, we have seen, and could again see, supply chain challenges in the automotive industry related to semiconductor devices that are used in automobiles that resulted in difficulties in entering into new contracts with our customers, a decline in revenues resulting from the decrease in the production and sale of automobiles by our customers, increased difficulties in collecting payment obligations from our customers and slowing or termination of our customers’ projects with us. These may be further exacerbated by potential global economic downturns that could result from future pandemics or disease outbreaks, which could further decrease consumer demand for vehicles or result in the financial distress of one or more of our customers.
Risks Relating to our Intellectual Property and Technology
Third parties have claimed and may claim in the future that we are infringing their intellectual property, and we could be exposed to significant litigation or licensing expenses or be prevented from selling our products if such claims are successful.
From time to time, we are subject to claims and legal actions alleging that we or our customers may be infringing or contributing to the infringement of the intellectual property rights of others. We may be unaware of intellectual property rights of others that may cover some of our technologies and products. If it appears necessary or desirable, we may seek licenses for these intellectual property rights. However, we may not be able to obtain licenses from some or all claimants, the terms of any offered licenses may not be acceptable to us, and we may not be able to resolve disputes without litigation. Any litigation regarding intellectual property could be costly and time-consuming and could divert the attention of our management and key personnel from our business operations. Intellectual property disputes could subject us to significant liabilities, require us to enter into royalty and licensing arrangements on unfavorable terms, prevent us from licensing certain of our products, cause severe disruptions to our operations or the markets in which we compete, or require us to satisfy indemnification commitments with our customers including contractual provisions under various arrangements. Any of these could seriously harm our business, financial condition or results of operations.
Unauthorized use of our proprietary technology and intellectual property could adversely affect our business and results of operations.
Our success and competitive position depend in large part on our ability to obtain and maintain intellectual property rights protecting our products and services. We rely on a combination of patents, copyrights, trademarks, service marks, trade secrets, confidentiality provisions and licensing arrangements to establish and protect our intellectual property and proprietary rights. Unauthorized parties may attempt to copy or discover aspects of our products or to obtain, license, sell or otherwise use information that we regard as proprietary. Policing unauthorized use of our products is difficult and we may not be able to protect our technology from unauthorized use. Additionally, our competitors may independently
21
develop technologies that are substantially the same or superior to our technologies and that do not infringe our rights. In these cases, we would be unable to prevent our competitors from selling or licensing these similar or superior technologies. In addition, the laws of some foreign countries do not protect our proprietary rights to the same extent as the laws of the United States.
Litigation may be necessary to enforce our intellectual property rights, including our patents, to protect our trade secrets, to determine the validity and scope of the proprietary rights of others, or to defend against claims of infringement or invalidity. For example, we have initiated legal proceedings to enforce or defend our intellectual property rights or the terms of existing agreements against multiple third parties. Litigation, regardless of the outcome, can be very expensive and can divert management’s efforts, which could harm our business and financial results, and third parties may have the ability to dedicate substantially greater resources to these legal actions than us. The potential outcomes of litigation are unpredictable and, as a result, there can be no assurance that we will prevail in any such litigation or, if we prevail, what remedies might be awarded. Also, our success with respect to litigation in one case may not necessarily mean that we will be successful in enforcing our intellectual property rights in a different situation. Moreover, such litigation has resulted, and may in the future result, in counterclaims against us which may be costly to defend and could subject us to significant liabilities or cause severe disruptions to our business. Accordingly, despite our efforts, we may not be able to prevent third parties from infringing upon or misappropriating our intellectual property rights, which could harm the Company’s business, financial condition and results of operations.
Our software products may have bugs, which could result in delayed or lost revenue, expensive correction, liability to our customers and claims against us.
Complex software products such as ours may contain errors, defects or bugs. Defects in the solutions or products that we develop and sell to our customers could require expensive corrections and result in delayed or lost revenue, adverse customer reaction and negative publicity about us or our products and services. Customers who are not satisfied with any of our products may also bring claims against us for damages, which, even if unsuccessful, would likely be time-consuming to defend, and could result in costly litigation and payment of damages. Such claims could harm our reputation, financial results and competitive position.
We may be unable to respond quickly enough to changes in technology and technological risks and to develop our intellectual property into commercially viable products.
Changes in legislative, regulatory or industry requirements or in competitive technologies may render certain of our products obsolete or less attractive to our customers, which could adversely affect our results of operations. Our ability to anticipate changes in technology and regulatory standards and to successfully develop and introduce new and enhanced products on a timely basis will be a significant factor in our ability to be competitive. There is a risk that we will not be able to achieve the technological advances that may be necessary for us to be competitive or that certain of our products will become obsolete. We are also subject to the risks generally associated with new product introductions and applications, including lack of market acceptance, delays in product development and failure of products to operate properly. These risks could have a material adverse effect on our business, results of operations and financial condition.
We utilize certain key technologies, content and services from, and integrate certain of our solutions with, third parties and may be unable to replace those technologies, content and services if they become obsolete, unavailable or incompatible with our solutions.
We utilize certain key technologies and content from, and/or integrate certain of our solutions with, hardware, software, services and content of third parties. Some of these vendors are also our competitors in various respects. These third-party vendors could, in the future, seek to charge us cost prohibitive fees for such use or integration or may design or utilize their solutions in a manner that makes it more difficult for us to continue to utilize their solutions, or integrate their technologies with our solutions, in the same manner or at all. Any significant interruption in the supply or maintenance of such third-party hardware, software, services or content could negatively impact our ability to offer our solutions unless and until we replace the functionality provided by this third-party hardware, software and/or content. In addition, we are dependent upon these third parties’ ability to enhance their current products, develop new products on a timely and cost-effective basis and respond to emerging industry standards and other technological changes. There can be no assurance that we would be able to replace the functionality or content provided by third-party vendors in the event that such technologies become obsolete or incompatible with future versions of our solutions or are otherwise not adequately maintained or updated. Any delay in or inability to replace any such functionality could have a material adverse effect on our business, results of operations and financial condition. Furthermore, delays in the release of new and upgraded versions
22
of third-party software applications could have a material adverse effect on our business, results of operations and financial condition.
Risks Relating to the Spin-Off
The allocation of intellectual property rights and data between Nuance and Cerence as part of the Spin-Off, the shared use of certain intellectual property rights and data following the Spin-Off and restrictions on the use of intellectual property rights, could adversely impact our reputation, our ability to enforce certain intellectual property rights that are important to us and our competitive position.
In connection with the Spin-Off, we entered into agreements with Nuance governing the allocation of intellectual property rights and data related to our business. These agreements include restrictions on our use of Nuance’s intellectual property rights and data licensed to us. Moreover, the licenses granted to us under Nuance’s intellectual property rights and data are non-exclusive, so Nuance may be able to license the rights and data to third parties that may compete with us. These agreements could adversely affect our position and options relating to intellectual property enforcement, licensing negotiations and monetization and access to data used in our business. We also may not have sufficient rights to grant sublicenses of intellectual property or data used in our business, and may be subject to third party rights pertaining to the underlying intellectual property or data, and may be unsuccessful in remedying any breaches of these agreements. These circumstances could adversely affect our ability to protect our competitive position in the industry and otherwise adversely affect our business, financial condition and results of operations.
Risks Relating to Our Securities and Indebtedness
We may evaluate whether to pay cash dividends on our common stock in the future.
We have not paid any dividends since our formation. Our Board's decisions regarding the payment of dividends depends on consideration of many factors, such as our financial condition, earnings, sufficiency of distributable reserves, opportunities to retain future earnings for use in the operation of our business and to fund future growth, capital requirements, debt service obligations, legal requirements, regulatory constraints and other factors that our Board deems relevant. There can be no assurance that we will pay a dividend in the future or continue to pay any dividend if we do commence paying dividends.
Servicing our debt may require a significant amount of cash. We may not have sufficient cash flow from our business to pay our indebtedness, and we may not have the ability to raise the funds necessary to settle for cash conversions of our outstanding 1.50% convertible senior notes due July 1, 2028 ($210 million of which were outstanding as of September 30, 2025, the "2028 Notes") or to repurchase the 2028 Notes for cash upon a fundamental change, which could adversely affect our business and results of operations.
In June 2020, we issued an aggregate principal amount of $175 million 3.00% convertible senior notes due June 1, 2025, the “2025 Notes.” In June 2023, we issued an aggregate principal amount of $210 million of the 2028 Notes (together with the 2025 Notes and the 2025 Modified Notes (as defined below), the “Notes”). The interest rate for the 2028 Notes is fixed at 1.50% per annum and is payable semi-annually in arrears on January 1 and July 1 of each year. We repurchased $87.5 million of the 2025 Notes with a portion of the proceeds from the sale of the 2028 Notes. The remaining outstanding principal balance on the 2025 Notes and accrued interest was repaid in its entirety at maturity during the three months ended June 30, 2025.
We may also incur additional indebtedness to meet future financing needs. Our indebtedness could have significant negative consequences for our stockholders and our business, results of operations and financial condition by, among other things: (a) increasing our vulnerability to adverse economic and industry conditions; (b) limiting our ability to obtain additional financing; (c) requiring the dedication of a substantial portion of our cash flow from operations to service our indebtedness, which will reduce the amount of cash available for other purposes; (d) limiting our flexibility to plan for, or react to, changes in our business; (e) diluting the interests of our existing stockholders as a result of issuing our common stock upon conversion of the 2028 Notes; and (f) placing us at a possible competitive disadvantage with competitors that are less leveraged than us or have better access to capital.
Our ability to make scheduled payments of the principal of, to pay interest on, or to refinance our indebtedness, including the 2028 Notes, depends on our future performance, which is subject to economic, financial, competitive, and other factors beyond our control. Our business may not generate cash flows from operations in the future that are sufficient to service our debt and make necessary capital expenditures. If we are unable to generate such cash flows, we may be required to adopt one or more alternatives, such as selling assets, restructuring debt, or obtaining
23
additional debt financing or equity capital on terms that may be onerous or highly dilutive. Our ability to refinance any future indebtedness will depend on the capital markets and our financial condition at such time. We may not be able to engage in any of these activities or engage in these activities on desirable terms, which could result in a default on our debt obligations. In addition, any future debt agreements may contain restrictive covenants that may prohibit us from adopting any of these alternatives.
Holders of the 2028 Notes have the right to require us to repurchase their 2028 Notes upon the occurrence of a fundamental change (as defined in the indenture governing the 2028 Notes) at a repurchase price equal to 100% of the principal amount of the 2028 Notes to be repurchased, plus accrued and unpaid interest, if any. Upon conversion, unless we elect to deliver solely shares of our common stock to settle such conversion (other than paying cash in lieu of delivering any fractional share), we will be required to make cash payments in respect of the 2028 Notes being converted. We may not have enough available cash or be able to obtain financing at the time we are required to make repurchases in connection with such conversion and our ability to pay may additionally be limited by law, by regulatory authority, or by agreements governing our existing and future indebtedness. Our failure to repurchase the 2028 Notes at a time when the repurchase is required by the indenture governing the 2028 Notes or to pay any cash payable on future conversions as required by such indenture would constitute a default under such indenture. A default under the indenture or the fundamental change itself could also lead to a default under agreements governing our existing and future indebtedness. If the repayment of the related indebtedness were to be accelerated after any applicable notice or grace periods, we may not have sufficient funds to repay the indebtedness and repurchase the 2028 Notes or make cash payments upon conversions thereof.
We may require additional financing, and we may not be able to obtain debt or equity financing on favorable terms, if at all. Any debt financing obtained by us could involve restrictive covenants relating to financial and operational matters, which may make it more difficult for us to obtain additional capital and to pursue business opportunities, including potential acquisitions. If we raise additional funds through further issuances of equity, convertible debt securities or other securities convertible into equity, our existing stockholders could experience significant dilution, and any new equity securities we issue could have rights, preferences, and privileges senior to those of holders of our common stock. The terms of any debt financing may include liquidity requirements, restrict our ability to pay dividends, and require us to comply with other restrictive covenants.
In addition, our current and/or future indebtedness, combined with our other financial obligations and contractual commitments, could have other important consequences. For example, it could:
•make us more vulnerable to adverse changes in general U.S. and worldwide economic, industry, and competitive conditions and adverse changes in government regulations;
•limit our flexibility in planning for, or reacting to, changes in our business and our industry;
•place us at a disadvantage compared to our competitors who have less debt;
•limit our ability to borrow additional amounts for funding acquisitions, for working capital, and for other general corporate purposes; and
•make an acquisition of our company less attractive or more difficult.
Any of these factors could harm our business, results of operations, and financial condition. In addition, if we incur additional indebtedness, the risks related to our business and our ability to service or repay our indebtedness would increase.
The conditional conversion feature of the 2028 Notes, if triggered, may adversely affect our financial condition and results of operations and the value of our common stock.
In the event the conditional conversion feature of the 2028 Notes is triggered, holders of the 2028 Notes will be entitled to convert the 2028 Notes at any time during specified periods at their option. If one or more holders elect to convert their 2028 Notes, unless we elect to satisfy our conversion obligation by delivering solely shares of our common stock (other than paying cash in lieu of delivering any fractional share), we would be required to settle a portion or all of our conversion obligation through the payment of cash, which could adversely affect our liquidity. In addition, even if holders do not elect to convert their 2028 Notes, we could be required under applicable accounting rules to reclassify all or a portion of the outstanding principal of the 2028 Notes as a current rather than long-term liability, which would result in a material reduction of our net working capital.
The conversion of some or all of the 2028 Notes would dilute the ownership interests of existing stockholders to the extent we satisfy our conversion obligation by delivering shares of our common stock upon any conversion of such 2028 Notes. Our 2028 Notes may become in the future convertible at the option of their holders under
24
certain circumstances. If holders of our 2028 Notes elect to convert their 2028 Notes, we may settle our conversion obligation by delivering to them a significant number of shares of our common stock, which would cause dilution to our existing stockholders.
The accounting method for convertible debt securities that may be settled in cash, such as the 2028 Notes, could have a material effect on our reported financial results.
Under FASB ASC Subtopic 470-20, Debt with Conversion and Other Options, or ASC 470-20, an issuer was required to separately account for the liability and equity components of convertible debt instruments (such as the 2028 Notes) that may be settled entirely or partially in cash upon conversion in a manner that reflects the issuer’s economic interest cost. ASC 470-20 requires the value of the conversion options of the 2028 Notes, representing the equity component, to be recorded as additional paid-in capital within stockholders’ equity in our consolidated balance sheet and as a discount to the 2028 Notes, which reduced their initial carrying value. The carrying value of the 2028 Notes, net of the applicable discount recorded, were accreted up to the principal amount of the 2028 Notes, as the case may be, from the issuance date until maturity, which resulted in non-cash charges to interest expense in our consolidated statement of operations.
In August 2020, the FASB issued Accounting Standards Update ASU 2020-06, or ASU 2020-06, with the intent to simplify ASC 470-20 and ASC subtopic 815-40, Contracts in Entity’s Own Equity, or ASC 815-40. Among the changes, ASU 2020-06 removed the requirement to bifurcate the liability and equity components of convertible debt instruments (such as the 2028 Notes) that may be settled entirely or partially in cash upon conversion. The removal of the bifurcation of liability and equity components eliminated non-cash interest expense corresponding to the amounts recorded within equity. In addition, ASU 2020-06 precludes the use of the treasury stock method, when calculating diluted earnings per share, for convertible debt instruments that may be settled entirely or partially in cash upon conversion. We adopted ASU 2020-06 on October 1, 2022 using the modified retrospective approach. Please see Note 2(t) for further discussion.
We currently apply the “if-converted” method for calculating any potential dilutive effect of the conversion options embedded in the 2028 Notes on diluted net income per share, which assumes that all of the 2028 Notes were converted solely into shares of common stock at the beginning of the reporting period, unless the result would be anti-dilutive. The application of the if-converted method may reduce our reported diluted net income per share to the extent we are profitable, and accounting standards may change in the future in a manner that may otherwise adversely affect our diluted net income per share.
Certain provisions in our Amended and Restated Certificate of Incorporation and Amended and Restated By-Laws and Delaware law may discourage takeovers.
Several provisions of our Amended and Restated Certificate of Incorporation, Amended and Restated By-Laws and Delaware law may discourage, delay or prevent a merger or acquisition. These include, among others, provisions that:
•do not permit our stockholders to act by written consent and require that stockholder action must take place at an annual or special meeting of our stockholders, in each case except as such rights may otherwise be provided to holders of preferred stock;
•establish advance notice requirements for stockholder nominations and proposals;
•provide that a special meeting of our stockholders may only be called by our Board, the Chairman of our Board or our Chief Executive Officer, or at the request of holders of not less than 20% of the outstanding shares of our common stock; and
•limit our ability to enter into certain business combination transactions.
These and other provisions of our Amended and Restated Certificate of Incorporation, Amended and Restated By-Laws and Delaware law may discourage, delay or prevent certain types of transactions involving an actual or a threatened acquisition or change in control of Cerence, including unsolicited takeover attempts, even though the transaction may offer our stockholders the opportunity to sell their shares of our common stock at a price above the prevailing market price.
Our organizational documents designate the courts within the State of Delaware or the U.S. district courts as the sole and exclusive forum for certain types of actions and proceedings that may be initiated by our stockholders, which could
25
limit our stockholders’ ability to obtain a favorable judicial forum for disputes with us or our directors, officers or other employees.
Our Amended and Restated Certificate of Incorporation provides, in all cases to the fullest extent permitted by law, unless we consent in writing to the selection of an alternative forum, the Court of Chancery of the State of Delaware is the sole and exclusive forum for any derivative action or proceeding brought on behalf of Cerence, any action asserting a claim of breach of a fiduciary duty owed by any director, officer or other employee or stockholder of Cerence to Cerence or Cerence’s stockholders, any action asserting a claim arising pursuant to the Delaware General Corporation Law, or DGCL, or as to which the DGCL confers jurisdiction on the Court of Chancery of the State of Delaware or any action asserting a claim governed by the internal affairs doctrine or any other action asserting an “internal corporate claim” as that term is defined in Section 115 of the DGCL. However, if the Court of Chancery within the State of Delaware does not have jurisdiction, the action may be brought in any other state or federal court located within the State of Delaware. Further, this exclusive forum provision would not apply to claims brought to enforce a duty or liability created by the Securities Exchange Act of 1934, as amended, or the Exchange Act, or the Securities Act of 1933, as amended, or the Securities Act, except that it may apply to such claims if brought derivatively on behalf of Cerence. Our Second Amended and Restated By-Laws further provide that, unless we consent in writing to the selection of an alternative forum, the federal district courts of the United States of America are the sole and exclusive forum for resolving any complaint asserting a cause of action arising under the Securities Act, the Exchange Act, or the respective rules and regulations promulgated thereunder.
Any person or entity purchasing or otherwise acquiring or holding any interest in shares of our capital stock will be deemed to have notice of and to have consented to these provisions. These provisions may limit a stockholder’s ability to bring a claim in a judicial forum that it finds favorable for disputes with us or our directors, officers or other employees, which may discourage such lawsuits. Alternatively, if a court were to find any of these provisions inapplicable to, or unenforceable in respect of, one or more of the specified types of actions or proceedings, we may incur additional costs associated with resolving such matters in other jurisdictions.
General Risk Factors
Tax matters may cause significant variability in our financial results and may impact our overall financial condition.
Our businesses are subject to income taxation in the United States, as well as in many tax jurisdictions throughout the world. Tax rates in these jurisdictions may be subject to significant change. If our effective tax rate increases, our operating results and cash flow could be adversely affected. Our effective income tax rate can vary significantly between periods due to a number of complex factors including:
•projected levels of taxable income;
•pre-tax income being lower than anticipated in countries with lower statutory rates or higher than anticipated in countries with higher statutory rates;
•increases or decreases to valuation allowances recorded against deferred tax assets;
•tax audits conducted and settled by various tax authorities;
•adjustments to income taxes upon finalization of income tax returns;
•the ability to claim foreign tax credits;
•the repatriation of non-U.S. earnings for which we have not previously provided for income taxes;
•changes in tax laws and their interpretations in countries in which we are subject to taxation; and
•changes to assessments of uncertain tax positions.
We regularly evaluate the need for a valuation allowance on deferred tax assets, considering historical profitability, projected future taxable income, the expected timing of the reversals of existing temporary differences and tax planning strategies. This analysis is heavily dependent upon our current and projected operating results. A decline in future operating results could provide substantial evidence that a full or partial valuation allowance for deferred tax assets is necessary, which could have a material adverse effect on our results of operations and financial condition.
26
The commercial and credit environment may adversely affect our access to, and the cost of, capital.
Our ability to issue debt or enter into other financing arrangements on acceptable terms could be adversely affected if there is a material decline in the demand for our products or in the solvency of our customers or suppliers or if there are other significantly unfavorable changes in economic conditions. Volatility in the world financial markets, including the recent increases in interest and inflation rates, could increase borrowing costs or affect our ability to access the capital markets. These conditions may adversely affect our ability to obtain targeted credit ratings.
Our stock price may fluctuate significantly.
The market price of our common stock may fluctuate widely, depending on many factors, some of which may be beyond our control, including:
•actual or anticipated fluctuations in our results of operations due to factors related to our business;
•success or failure of our business strategies;
•competition and industry capacity;
•changes in interest rates and other factors that affect earnings and cash flow;
•our level of indebtedness, our ability to make payments on or service our indebtedness and our ability to obtain financing as needed;
•our ability to retain and recruit qualified personnel;
•our quarterly or annual earnings, or those of other companies in our industry;
•announcements by us or our competitors of significant acquisitions or dispositions;
•changes in accounting standards, policies, guidance, interpretations or principles;
•the failure of securities analysts to cover, or positively cover, our common stock;
•changes in earnings estimates by securities analysts or our ability to meet those estimates;
•the operating and stock price performance of other comparable companies;
•investor perception of our company and our industry;
•overall market fluctuations unrelated to our operating performance;
•results from any material litigation or government investigation;
•changes in laws and regulations (including tariffs, trade regulations, and tax laws and regulations) affecting our business;
•changes in capital gains taxes and taxes on dividends affecting stockholders; and
•general economic and political conditions, government shutdowns, war, conflict or other political instability, and other external factors.
Low trading volume for our stock would amplify the effect of the above factors on our stock price volatility.
Should the market price of our shares drop significantly, stockholders may institute securities class action lawsuits against us. A lawsuit against us could cause us to incur substantial costs and could divert the time and attention of our management and other resources.
Your percentage ownership in Cerence may be diluted in the future.
Your percentage ownership in Cerence may be diluted in the future because of equity issuances for acquisitions, capital market transactions or otherwise, including equity awards that we grant to our directors, officers, employees and other service providers. Our Board has adopted the Cerence 2019 Equity Incentive Plan, as well as the 2024 Inducement Plan, for the benefit of certain of our current and future employees, service providers and non-employee directors. Such awards will have a dilutive effect on our earnings per share, which could adversely affect the market price of our common stock.
27
In addition, our Amended and Restated Certificate of Incorporation authorizes us to issue, without the approval of our stockholders, one or more classes or series of preferred stock having such designation, powers, preferences and relative, participating, optional and other special rights, including preferences over our common stock with respect to dividends and distributions, as our Board may generally determine. The terms of one or more classes or series of preferred stock could dilute the voting power or reduce the value of our common stock. For example, we could grant the holders of preferred stock the right to elect some number of the members of our Board in all events or upon the happening of specified events, or the right to veto specified transactions. Similarly, the repurchase or redemption rights or liquidation preferences that we could assign to holders of preferred stock could affect the residual value of our common stock.
From time to time, we may opportunistically evaluate and pursue acquisition opportunities, including acquisitions for which the consideration thereof may consist partially or entirely of newly-issued shares of our common stock and, therefore, such transactions, if consummated, would dilute the voting power and/or reduce the value of our common stock.
If we fail to maintain proper and effective internal controls, our ability to produce accurate and timely financial statements could be impaired and investors’ views of us could be harmed.
The Sarbanes-Oxley Act requires, among other things, that we maintain effective internal control over financial reporting and disclosure controls and procedures. In particular, we must perform system and process evaluation and testing of our internal control over financial reporting to allow management and our independent registered public accounting firm to report on the effectiveness of our internal control over financial reporting, as required by Section 404 of the Sarbanes-Oxley Act. If we are not able to comply with the requirements of Section 404 in a timely manner, or if we or our independent registered public accounting firm identify deficiencies in our internal control over financial reporting that are deemed to be material weaknesses, the market price of shares of our common stock could decline and we could be subject to sanctions or investigations by the SEC or other regulatory authorities, which would require additional financial and management resources.
Our ability to successfully implement our business plan and comply with Section 404 of the Sarbanes-Oxley Act requires us to be able to prepare timely and accurate financial statements. Any delay in the implementation of, or disruption in the transition to, new or enhanced systems, procedures or controls may cause our operations to suffer, and we may be unable to conclude that our internal control over financial reporting is effective and to obtain an unqualified report on internal controls from our auditors as required under Section 404 of the Sarbanes-Oxley Act. Moreover, we cannot be certain that these measures would ensure that we implement and maintain adequate controls over our financial processes and reporting in the future. Even if we were to conclude, and our auditors were to concur, that our internal control over financial reporting provided reasonable assurance regarding the reliability of financial reporting and the preparation of financial statements for external purposes in accordance with generally accepted accounting principles in the United States, or GAAP, because of its inherent limitations, internal control over financial reporting might not prevent or detect fraud or misstatements. This, in turn, could have an adverse impact on trading prices for shares of our common stock, and could adversely affect our ability to access the capital markets.
Item 1B. Unresolved Staff Comments.
None.
Item 1C. Cybersecurity.
Cyber Risk Management and Strategy
28
Governance Related to Cybersecurity Risks
Item 2. Properties.
Our corporate headquarters is located in Burlington, Massachusetts. Other large, leased sites include properties located in: Aachen and Ulm, Germany; Heerlen, Netherlands; Montreal, Canada; Shanghai and Chengdu, China; Merelbeke, Belgium; Turin, Italy; and Pune, India.
We believe our planned facilities and equipment are in good operating condition and are suitable for the conduct of our business.
Item 3. Legal Proceedings.
Derivative Actions
On May 10 and 12, 2022, respectively, plaintiffs William Shafer and Peter Morse filed shareholder derivative complaints in the United States District Court for the District of Massachusetts on behalf of Cerence Inc. against defendants (and former officers) Sanjay Dhawan and Mark J. Gallenberger as well as board members Arun Sarin, Thomas Beaudoin, Marianne Budnik, Sanjay Jha, Kristi Ann Matus, Alfred Nietzel and then-current CEO and board member Stefan Ortmanns. These actions are premised on factual contentions substantially similar to those made in the Securities Action (as defined below) and contain substantially similar legal contentions. As such, on June 13, 2022, at the parties’ request, the court consolidated these derivative actions into a single action and appointed co-lead counsel for plaintiffs in that consolidated action. On February 3, 2025, defendants filed a motion to dismiss on the grounds of demand futility and failure to state a claim. On June 18, 2025, the Court granted the motion without leave to amend.
Three shareholder derivative complaints making factual and legal contentions substantially similar to those raised in the consolidated federal derivative action were also filed in the Delaware Court of Chancery: the first filed on October 19, 2022 by plaintiff Melinda Hipp against the defendants named in the consolidated federal derivative action and board member Douglas Davis, the second filed on August 17, 2023 by plaintiff Catherine Fleming against the defendants named in the consolidated federal derivative action, and the third filed on July 10, 2024 by plaintiff Alberto Goncalves against the defendants named in the consolidated federal derivative action. On October 20, 2023, Ms. Hipp voluntarily dismissed her action with prejudice. On July 22, 2025, Mr. Goncalves's action was dismissed without prejudice at his request. On July 31, 2025, Ms. Fleming's action was dismissed without prejudice by stipulation of the parties.
A.P., a minor, by and through her guardian, Carlos Pena and Carlos Pena Action
On March 24, 2023, plaintiffs A.P., a minor, by and through her guardian, Carlos Pena, and Carlos Pena, each individually and on behalf of similarly situated individuals filed a purported class action lawsuit in the Circuit Court of Cook County, Illinois, Chancery Division (Case. No. 2023CH02866 (Cir. Ct. Cook Cnty. 2023)). The case was removed to Federal Court (Case No. 1:23CV2667 (N.D. Ill.)), and then severed and remanded back in part, so there are two pending cases. Plaintiffs subsequently amended the federal complaint twice, with the latest second amended complaint, filed on July 13, 2023, adding plaintiffs Randolph Freshour and Vincenzo Allan, each also filing individually and on behalf of similarly situated individuals. Plaintiffs allege that Cerence violated the Illinois Biometric Information Privacy Act (“BIPA”), 740 ILCS 14/1 et seq. through Cerence’s Drive Platform technology, which is integrated in various automobiles. The named plaintiffs allegedly drove or rode in a vehicle with Cerence’s Drive Platform technology. Across both cases, plaintiffs allege that Cerence violated: (1) BIPA Section 15(a) by possessing biometrics without any public written policy for their
29
retention or destruction; (2) BIPA Section 15(b) by collecting, capturing, or obtaining biometrics without written notice or consent; (3) BIPA Section 15(c) by profiting from biometrics obtained from Plaintiffs and putative class members; and (4) BIPA Section 15(d) by disclosing biometrics to third party companies without consent. Cerence filed motions to dismiss both cases. On February 27, 2024, the Circuit Court issued an order denying Cerence's motion to dismiss. On April 16, 2024, Cerence filed its answer and affirmative defenses, a motion to certify the Court’s order on Cerence’s motion to dismiss, and a motion to stay. Thereafter, in exchange for Cerence withdrawing its motions to certify and stay, plaintiffs filed amended complaints in both the Circuit Court and Federal Court, which 1) dismissed some plaintiffs and 2) amended the class definition to include Illinois individuals who owned, leased, and/or created user profiles for vehicles with Cerence's "voice recognition technology" (rather than anyone in Illinois whose "voiceprint" was collected or stored by Cerence). Cerence filed its answers in both and the parties concluded fact discovery. The parties are now briefing class certification, which briefing is scheduled to be complete on December 15, 2025. On November 3, 2025, plaintiffs moved to stay the Federal Court case pending the Circuit Court's ruling on class certification. Plaintiffs are seeking statutory damages of $5,000 for each willful and/or reckless violation of BIPA and, alternatively, damages of $1,000 for each negligent violation of BIPA. Given the uncertainty of litigation, the preliminary stage of the case, and the legal standards that must be met for, among other things, class certification and success on the merits, we cannot estimate the reasonably possible loss or range of loss that may result from this action.
Samsung Electronics Co. Ltd and Samsung Electronics America, Inc.
On October 13, 2023, Cerence filed its first patent infringement complaint against Samsung alleging infringement of five Cerence patents (hereinafter referred to as “Samsung I”). On March 15, 2024, Cerence filed its second patent infringement complaint against Samsung alleging infringement of four additional Cerence patents (hereinafter referred to as “Samsung II”). In its responsive pleading to Samsung II, on July 10, 2024, Samsung asserted counterclaims, alleging infringement of U.S. Patent Nos. 10,395,657; 10,720,162; 11,823,682; and 9,583,103 against the Cerence Assistant. Samsung sought damages, including trebled damages, and its costs and fees. On September 4, 2024, Cerence filed its answer denying the allegations and counterclaims of invalidity and noninfringement. Trial for Samsung I was scheduled to begin in October 2025 and trial for Samsung II was scheduled to begin in April 2026. On October 28, 2025 Samsung and Cerence resolved these disputes by entering into a cross-license agreement, which, among other things, resulted in Samsung agreeing to pay Cerence a one-time lump sum payment in the total amount of $49.5 million, due within 30 days. The cross-license agreement requires that each party is responsible for bearing their own costs for any associated legal fees incurred as a result of the alleged complaints and negotiations resulting in the dispute resolution. As a result, our final receipt of the one-time lump-sum payment will result in us incurring approximately $24.6 million in legal fees.
Other Legal Proceedings
From time to time, we may become a party to other legal proceedings, including, without limitation, product liability claims, employment matters, commercial disputes, governmental inquiries and investigations (which may in some cases involve our entering into settlement arrangements or consent decrees), and other matters arising out of the ordinary course of our business. While the results of any legal proceeding cannot be predicted with certainty, in our opinion none of our pending matters are currently anticipated to have a material adverse effect on our consolidated financial position, liquidity or results of operations.
Item 4. Mine Safety Disclosures.
Not applicable.
30
PART II
Item 5. Market for Registrant’s Common Equity, Related Stockholder Matters and Issuer Purchases of Equity Securities.
Our common stock has been listed on the Nasdaq Global Select Market under the symbol “CRNC” since October 2, 2019. Prior to that date, there was no public trading market for our common stock. A “when-issued” trading market for our common stock existed between September 17, 2019 and October 1, 2019 under the symbol “CRNCV”.
Holders of Common Stock
As of November 7, 2025, there were 415 holders of record of our common stock. This number does not reflect beneficial owners whose shares are held in street name.
Dividend Policy
We have not paid any dividends since our formation. We may evaluate whether to pay cash dividends to our stockholders. The timing, declaration, amount and payment of future dividends to stockholders, if any, will fall within the discretion of our Board. Among the items we would consider in establishing a dividend policy are the capital needs of our business and opportunities to retain future earnings for use in the operation of our business and to fund future growth. Additionally, the terms of the Senior Credit Facilities limit our ability to pay cash dividends. There can be no assurance that we will pay a dividend in the future or continue to pay any dividend if we do commence the payment of dividends.
Performance Graph
The graph below compares the cumulative total shareholder return of our common stock for the last five years with the Russell 2000 and the S&P Software & Services Select indices. The information presented assumes an initial investment of $100 on October 1, 2020. The graph shows the value that each of these investments would have had at the end of each fiscal year.
The comparisons shown in the graph below are based upon historical data. We caution that the stock price performance shown in the graph below is not necessarily indicative of, nor is it intended to forecast, the potential future performance of our common stock. The total return performance graph does not assume the reinvestment of dividends for the Company’s common stock. As mentioned in Dividend Policy above, the Company does not currently pay nor reinvest dividends.
31
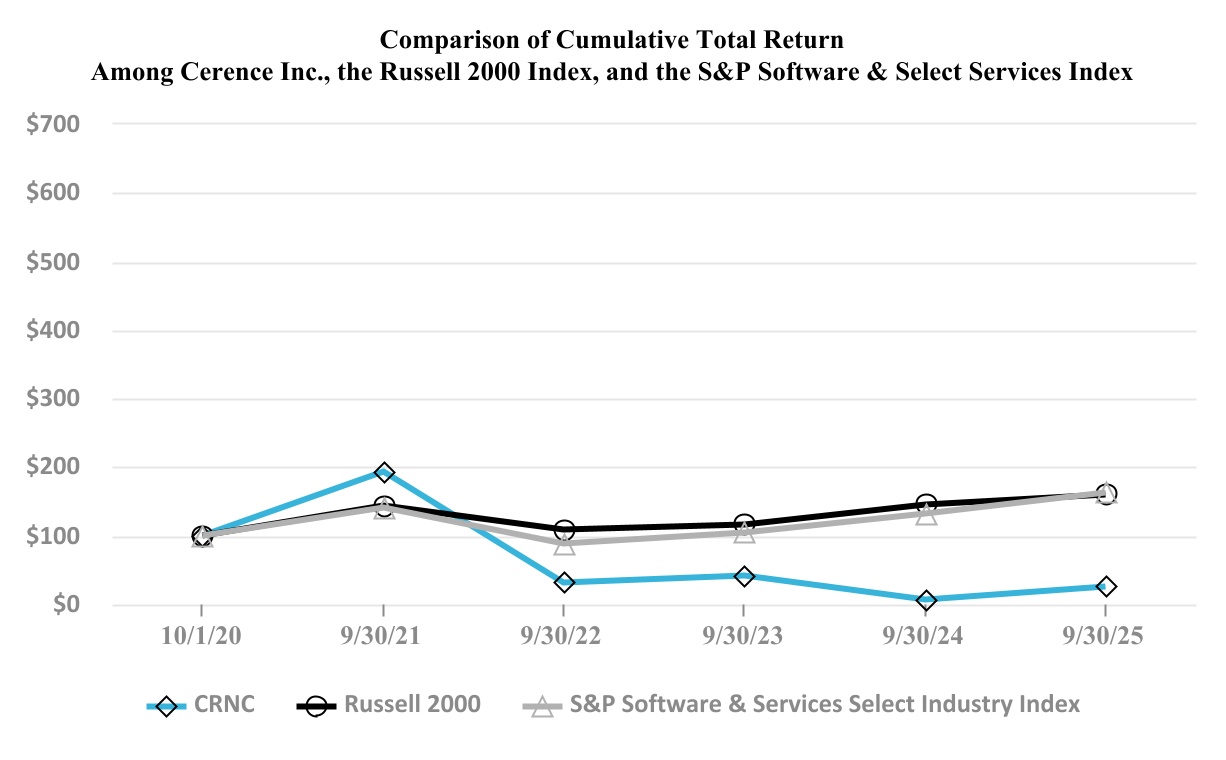
| October 1, 2020 | 9/30/2021 | 9/30/2022 | 9/30/2023 | 9/30/2024 | 9/30/2025 | ||||||||||||||||||||||||||||||
| Cerence Inc. | $ | 100.00 | $ | 193.22 | $ | 31.66 | $ | 40.95 | $ | 6.33 | $ | 25.05 | |||||||||||||||||||||||
| Russell 2000 | $ | 100.00 | $ | 143.96 | $ | 108.72 | $ | 116.58 | $ | 145.64 | $ | 159.12 | |||||||||||||||||||||||
| S&P Software & Services Select | $ | 100.00 | $ | 141.30 | $ | 88.05 | $ | 104.55 | $ | 132.24 | $ | 162.71 | |||||||||||||||||||||||
Recent Sales of Unregistered Securities and Use of Proceeds
None.
Issuer Purchases of Equity Securities
Not applicable.
Item 6. Reserved.
Not applicable.
32
Item 7. Management’s Discussion and Analysis of Financial Condition and Results of Operations.
Management’s Discussion and Analysis of Financial Condition and Results of Operations, (the “MD&A”), describes the principal factors, based on management’s assessment, which had a material impact on our results of operations, financial condition and liquidity, as well as our critical accounting estimates. Our MD&A generally includes a discussion of results of operations, financial condition, liquidity and capital resources related to year-over-year comparisons between fiscal years ended September 30, 2025 and 2024, as well as fiscal years ended September 30, 2024 and 2023.
The following discussion and analysis presented below should be read in conjunction with the Consolidated Financial Statements and the corresponding notes, included elsewhere in this Form 10-K. The information presented in this section includes forward-looking statements, which are described in detail in the section titled “Cautionary Statement Concerning Forward-Looking Statements.” The matters discussed in these forward-looking statements are subject to risks, uncertainties, and other factors that could cause actual results to differ materially from those made, projected, or implied in the forward-looking statements. See Item 1A.“Risk Factors” for a discussion of the risks, uncertainties, and assumptions associated with these statements.
Overview
Cerence builds conversational and agentic AI solutions for the mobility/transportation market. Our primary target is the automobile market, but our solutions can apply to all forms of transportation including, but not limited to, two-wheel vehicles, planes, tractors, cruise ships and elevators as well as the Internet of Things industry as a whole, including televisions, smart watches, voice-powered kiosks, and more. Our solutions power natural conversational and intuitive interactions between automobiles, drivers and passengers, and the broader digital world. We possess one of the leading software platforms for building automotive virtual assistants. Our automotive customers include nearly all major automobile original equipment manufacturers (“OEMs”) or their tier 1 suppliers worldwide. We deliver our solutions on a white-label basis, enabling our customers to deliver customized virtual assistants with unique, branded personalities and ultimately strengthening the bond between automobile brands and end users. Our vision is to enable a more enjoyable, safer journey for everyone.
Our principal offering is our software platform, which our customers use to build virtual assistants that can communicate, find information and take action across an expanding variety of categories. Our software platform has a hybrid architecture combining edge software components with cloud-connected components. Edge software components are installed on a vehicle’s head unit and can operate without access to external networks and information. Cloud-connected components are comprised of certain speech and natural language understanding related technologies, AI-enabled personalization and context-based response frameworks, and content integration platform.
We generate revenue primarily by selling software or intellectual property (“IP”) licenses and cloud-connected services. Our edge software components are typically sold under a traditional per unit perpetual software license model, in which a per unit fee is charged on a variable basis for each software instance installed on an automotive head unit. We typically license cloud-connected software components in the form of a service to the vehicle end user, which is paid for in advance. In addition, we generate professional services revenue from our work with our customers during the design, development and deployment phases of the vehicle model lifecycle and through maintenance and enhancement projects. We have existing relationships with nearly all major automotive OEMs or their tier 1 suppliers, and while our customer contracts vary, they generally represent multi-year engagements, giving us some visibility into future revenue; however, such revenue may not materialize as expected due to delays in automobile production, volatility in the political, legal and regulatory environment in which we operate including trade, tariffs and other policies implemented by the administration in the United States or actions taken by other countries in response, automotive production curtailment or delays related thereto, changing customer forecasts, macroeconomic conditions or other factors discussed elsewhere in this Annual Report.
Business Trends
We experienced a 24.0% decrease in total revenue during fiscal year 2025. The decrease in revenues was driven by a decrease in connected services revenue due to the early termination of a legacy contract acquired by Nuance through a 2013 acquisition and the termination of services provided to a separate customer, who in turn provided services to our legacy customer. The effect of this change was to accelerate $67.8 million of deferred revenue into the first quarter of fiscal year 2024. The decrease was partially offset by an increase in license revenue primarily due to an increase in volume of licensing royalties. Our license revenue is highly dependent on vehicle production, the timing and volume of which continues to be impacted by the changing dynamics in the global automotive industry. Macroeconomic conditions
33
such as high interest rates and lack of credit availability have contributed to production delays and slowdowns. The decrease in our professional services revenues was primarily driven by the increased standardization of our software product offerings, which requires less professional services effort to implement, other efficiencies in our professional services processes and, in some cases, customers opting to perform these activities internally.
During fiscal year 2025, total cost of revenues decreased by 21.3% compared to fiscal year 2024, primarily driven by the declines in connected services and professional services revenues. Total operating expenses decreased by 77.5% during fiscal year 2025, primarily driven by the impairment of goodwill recognized in fiscal year 2024 and our ongoing business transformation and cost reduction efforts. Restructuring and other costs, net decreased $1.7 million, driven by the wind-down of restructuring efforts initiated in 2024.
Basis of Presentation
The accompanying consolidated financial statements have been prepared in accordance with GAAP, and the rules and regulations of the SEC. The consolidated financial statements reflect all adjustments considered necessary for a fair presentation of the consolidated results of operations and financial position for the fiscal years presented. All such adjustments are of a normal recurring nature.
The consolidated financial statements include the accounts of the Company, as well as those of its wholly owned subsidiaries. All significant intercompany transactions and balances are eliminated in consolidation.
Key Financial Metrics
In evaluating our financial condition and operating performance, we focus on revenue, operating margins, and cash flow from operations.
For the fiscal year 2025 as compared to fiscal year 2024:
•Total revenue decreased by $79.7 million, or 24.0%, from $331.5 million to $251.8 million.
•Operating margin increased by 174.0 percentage points from negative 174.9% to negative 0.9%.
•Cash from operating activities changed by $44.0 million, or 255.7%, from cash provided by operating activities of $17.2 million to cash provided by operating activities of $61.2 million.
For fiscal year 2024 as compared to fiscal year 2023:
•Total revenue increased by $37.0 million, or 12.6%, from $294.5 million to $331.5 million.
•Operating margin decreased by 165.7 percentage points from negative 9.2% to negative 174.9%.
•Cash from operating activities changed by $9.7 million, or 129.4%, from cash provided by operating activities of $7.5 million to cash provided by operating activities of $17.2 million.
Operating Results
The following table shows the Consolidated Statements of Operations for the fiscal years 2025, 2024 and 2023 (dollars in thousands):
34
| 2025 | 2024 | 2023 | |||||||||||||||
| Revenues: | |||||||||||||||||
| License | $ | 140,625 | $ | 124,746 | $ | 145,159 | |||||||||||
| Connected services | 53,358 | 133,444 | 75,071 | ||||||||||||||
| Professional services | 57,798 | 73,314 | 74,245 | ||||||||||||||
| Total revenues | 251,781 | 331,504 | 294,475 | ||||||||||||||
| Cost of revenues: | |||||||||||||||||
| License | $ | 6,941 | $ | 6,060 | $ | 8,522 | |||||||||||
| Connected services | 21,418 | 24,787 | 22,995 | ||||||||||||||
| Professional services | 40,286 | 56,282 | 63,232 | ||||||||||||||
| Amortization of intangibles | — | 103 | 414 | ||||||||||||||
| Total cost of revenues | 68,645 | 87,232 | 95,163 | ||||||||||||||
| Gross profit | 183,136 | 244,272 | 199,312 | ||||||||||||||
| Operating expenses: | |||||||||||||||||
| Research and development | $ | 97,756 | $ | 121,563 | $ | 123,333 | |||||||||||
| Sales and marketing | 21,815 | 21,725 | 27,504 | ||||||||||||||
| General and administrative | 48,770 | 52,468 | 57,903 | ||||||||||||||
| Amortization of intangible assets | 1,668 | 2,203 | 5,854 | ||||||||||||||
| Restructuring and other costs, net | 15,418 | 17,077 | 11,917 | ||||||||||||||
| Goodwill impairment | — | 609,172 | — | ||||||||||||||
| Total operating expenses | 185,427 | 824,208 | 226,511 | ||||||||||||||
| Loss from operations | (2,291) | (579,936) | (27,199) | ||||||||||||||
| Interest income | 3,853 | 5,353 | 4,471 | ||||||||||||||
| Interest expense | (10,223) | (12,553) | (14,769) | ||||||||||||||
| Other (expense) income, net | (160) | 2,526 | 1,108 | ||||||||||||||
| Loss before income taxes | (8,821) | (584,610) | (36,389) | ||||||||||||||
| Provision for income taxes | 9,893 | 3,468 | 19,865 | ||||||||||||||
| Net loss | $ | (18,714) | $ | (588,078) | $ | (56,254) | |||||||||||
Our revenue consists primarily of license revenue, connected services revenue and revenue from professional services. License revenue primarily consists of license royalties associated with our edge software components. Our edge software components are typically sold under a traditional per unit perpetual software license model, in which a per unit fee is charged for each software instance installed on an automotive head unit. Our contracts contain variable, fixed prepaid or fixed minimum purchase commitment components. Revenue is recognized and cash is collected for variable contracts over the license distribution period. The fixed contracts typically provide the customer with a price discount and can include the conversion of a variable contract that is already in our variable backlog. Revenue for fixed contracts is recognized when the software is made available to the customer, which has typically occurred at the time the contract is signed. Cash is typically expected to be collected for a fixed prepaid deal at the inception of the contract. Cash is expected to be collected for a fixed minimum commitment deal over the license distribution period. During fiscal year 2023, we had a reduction in contributions from our fixed license contracts due to our decision to limit the level of such contracts on a go-forward basis which contributed to a decline in reported license revenue for fiscal years 2023, 2024 and 2025. Going forward, we will continue to assess the levels of fixed license contracts and make adjustments, as necessary. See Note 3 to the accompanying consolidated financial statements for further discussion of our revenue, deferred revenue performance obligations and the timing of revenue recognition. Costs of license revenue primarily consists of third-party royalty expenses for certain external technologies we leverage and costs associated with our Cerence Link product.
Connected services revenue primarily represents the subscription fee that provides access to our connected services components, including the customization and construction of our connected services solutions. We also derive revenue within our connected services business from usage contracts and there can be instances where a customer purchases a software license that allows them to take possession of the software to enable hosting by the customer or a third-party. Subscription and usage contracts typically have a term of one to five years. Subscription revenue is recognized over the subscription period and cash is expected to be collected at the start of the subscription period. Usage based
35
revenue is recognized and cash is collected as the service is used. If the customer takes possession of the software to have it hosted by the customer or a third-party, revenue is recognized, and cash is collected at the time the license is delivered. On October 31, 2023, we entered into an early termination agreement relating to a legacy contract acquired by Nuance through a 2013 acquisition. Previously, the term of the contract ended on December 31, 2025, whereas the agreement signed on October 31, 2023 updated the termination date to December 31, 2023. The effect of this change was to accelerate $67.8 million of deferred revenue into the first quarter of fiscal year 2024. There was no cash flow associated with this legacy contract. We provided services to a separate customer, who in turn provided services to our legacy customer. This separate customer terminated services on October 31, 2023. There was no cash flow associated with this contract. The effect of this termination was to accelerate $9.9 million of deferred revenue into the first quarter of fiscal year 2024. See Note 3 to the accompanying consolidated financial statements for further discussion of our revenue, deferred revenue performance obligations and the timing of revenue recognition. Cost of connected service revenue primarily consists of labor costs of software delivery services, infrastructure, and communications fees that support our connected services solutions. During the first quarter of fiscal year 2024, we had an acceleration of $2.0 million of expenses associated with the termination of the legacy contract acquired by Nuance through a 2013 acquisition.
Professional services revenue is primarily comprised of porting, integrating, and customizing our embedded solutions, with costs primarily consisting of compensation for services personnel, contractors and overhead.
Our operating expenses include R&D, sales and marketing and general and administrative expenses. R&D expenses primarily consist of salaries, benefits, and overhead relating to research and engineering staff. Sales and marketing expenses includes salaries, benefits, and commissions related to our sales, product marketing, product management, and business unit management teams. General and administrative expenses primarily consist of personnel costs for administration, legal, finance, human resources, general management, fees for external professional advisers including accountants and attorneys, and provisions for credit losses.
Amortization of acquired patents and core technology are included within cost of revenues whereas the amortization of other intangible assets, such as acquired customer relationships, trade names and trademarks, are included within operating expenses. Customer relationships are amortized over their estimated economic lives based on the pattern of economic benefits expected to be generated from the use of the asset. Other identifiable intangible assets are amortized on a straight-line basis over their estimated useful lives.
Other components of operating expenses include restructuring and other costs, net and goodwill impairment. Restructuring and other costs, net include restructuring expenses as well as other charges that are unusual in nature, are the result of unplanned events, and arise outside the ordinary course of our business. Goodwill impairment is recognized on a non-recurring basis when the carrying value of our reporting unit exceeds the estimated fair value.
Total other expense, net consists primarily of foreign exchange gains (losses), losses on our investments in convertible notes, gains (losses) on the extinguishment of debt and interest expense related to the Notes.
We expect our revenue to continue to be impacted by the changing dynamics in the global automotive industry which has experienced production delays and slowdowns. Volatility in the political, legal and regulatory environment in which we operate, including trade, tariffs and related policies also has resulted in increased pricing pressure from customers and delays in program timelines. Macroeconomic conditions such as high interest rates and lack of credit availability have contributed to these production delays and slowdowns. In addition, the software and technology systems in automobiles have become increasingly complex, leading to substantial challenges and delays in production for some of our customers. Our business in adjacent markets, such as two-wheeled vehicles, trucks and AIoT, is also developing slower than anticipated due to the challenges of introducing different technology into a new market. In light of these challenges, we intend to make efforts to streamline our operations, and we continue to focus on our cost management and have taken, and expect to continue to take, cost reduction actions, which may result in additional restructuring costs. In particular, in September 2025, we announced the 2025 Plan intended to streamline certain operations. In August 2024, we announced the 2024 Plan intended to reduce operating expenses and position us for profitable growth. During fiscal year 2025, we incurred approximately $15.4 million of restructuring charges as part of the 2024 Plan and currently estimate cash charges of approximately $7.4 million to $7.6 million during fiscal year 2026, as part of the 2025 Plan. The implementation of the 2024 Plan was substantially complete by the end of the first quarter of fiscal year 2025 and the implementation of the 2025 Plan is expected to be substantially complete by the end of the first quarter of fiscal year 2026. Potential position eliminations are subject to legal requirements that vary by jurisdiction, which may extend this process beyond the first quarter of fiscal year 2026 in certain cases. The charges that we expect to incur from the implementation of the 2025 Plan are subject to a number of assumptions, including legal requirements in various jurisdictions, and actual expenses and charges may differ materially from the estimates disclosed above. For additional details, refer to Item 1A. Risk Factors.
36
Fiscal Year 2025 Compared with Fiscal Year 2024 and Fiscal Year 2024 Compared with Fiscal Year 2023
Total Revenues
The following table shows total revenues by product type, including the corresponding percentage change (dollars in thousands):
| Year Ended September 30, | % Change | % Change | |||||||||||||||||||||||||||||||||||||||||||||
| 2025 | % of Total | 2024 | % of Total | 2023 | % of Total | 2025 vs. 2024 | 2024 vs. 2023 | ||||||||||||||||||||||||||||||||||||||||
| License | $ | 140,625 | 55.9% | $ | 124,746 | 37.6% | $ | 145,159 | 49.3% | 12.7 | % | (14.1) | % | ||||||||||||||||||||||||||||||||||
| Connected services | 53,358 | 21.2% | 133,444 | 40.3% | 75,071 | 25.5% | (60.0) | % | 77.8 | % | |||||||||||||||||||||||||||||||||||||
| Professional services | 57,798 | 23.0% | 73,314 | 22.1% | 74,245 | 25.2% | (21.2) | % | (1.3) | % | |||||||||||||||||||||||||||||||||||||
| Total revenues | $ | 251,781 | $ | 331,504 | $ | 294,475 | (24.0) | % | 12.6 | % | |||||||||||||||||||||||||||||||||||||
Fiscal Year 2025 Compared with Fiscal Year 2024
Total revenues for fiscal year 2025 were $251.8 million, a decrease of $79.7 million, or 24.0%, from $331.5 million from fiscal year 2024. The decrease in revenues was driven by connected services revenue due to the early termination of a legacy contract in fiscal year 2024 acquired by Nuance through a 2013 acquisition and the termination of services provided to a separate customer, who in turn provided services to our legacy customer (hereinafter the "2013 Nuance Legacy Contract Termination"). The decrease was partially offset by increases in license revenue primarily due to higher volume of licensing royalties.
License Revenue
License revenue for fiscal year 2025 was $140.6 million, an increase of $15.9 million, or 12.7%, from $124.7 million for fiscal year 2024. The increase in license revenue was driven by a $24.1 million increase in variable license revenue due to higher volume of licensing royalties, primarily offset by a $8.2 million decrease in fixed contracts. As a percentage of total revenue, license revenue increased by 18.2 percentage points from 37.6% for fiscal year 2024 to 55.9% for fiscal year 2025.
Connected Services Revenue
Connected services revenue for fiscal year 2025 was $53.4 million, a decrease of $80.1 million, or 60.0%, from $133.4 million for fiscal year 2024. This decrease was primarily driven by the 2013 Nuance Legacy Contract Termination. As a percentage of total revenue, connected services revenue decreased by 19.1 percentage points from 40.3% for fiscal year 2024 to 21.2% for fiscal year 2025.
Professional Services Revenue
Professional services revenue for fiscal year 2025 was $57.8 million, a decrease of $15.5 million, or 21.2%, from $73.3 million for fiscal year 2024. This decrease was primarily driven by the increased standardization of our software product offerings, which requires less professional services effort to implement, other efficiencies in our professional services processes and, in some cases, customers opting to perform these activities internally. As a percentage of total revenue, professional services revenue increased by 0.8 percentage points from 22.1% for fiscal year 2024 to 23.0% for fiscal year 2025.
Fiscal Year 2024 Compared with Fiscal Year 2023
Total revenues for fiscal year 2024 were $331.5 million, an increase of $37.0 million, or 12.6%, from $294.5 million from fiscal year 2023. The increase in revenues was driven by connected services revenue due to the 2013 Nuance Legacy Contract Termination. The increase was partially offset by decreases in license revenue primarily due to lower volume of licensing royalties.
37
License Revenue
License revenue for fiscal year 2024 was $124.7 million, a decrease of $20.5 million, or 14.1%, from $145.2 million for fiscal year 2023. The decrease in license revenue was driven by a $14.6 million decrease in variable license revenue due to lower volume of licensing royalties and a $6.1 million decrease in fixed contracts. As a percentage of total revenue, license revenue decreased by 11.7 percentage points from 49.3% for fiscal year 2023 to 37.6% for fiscal year 2024.
Connected Services Revenue
Connected services revenue for fiscal year 2024 was $133.4 million, an increase of $58.3 million, or 77.8%, from $75.1 million for fiscal year 2023. This increase was primarily driven by the 2013 Nuance Legacy Contract Termination. The effect of these changes was an acceleration of $67.8 million and $9.9 million of deferred revenue, respectively, into the first quarter of fiscal year 2024. As a percentage of total revenue, connected services revenue increased by 14.8 percentage points from 25.5% for fiscal year 2023 to 40.3% for fiscal year 2024.
Professional Services Revenue
Professional services revenue for fiscal year 2024 was $73.3 million, a decrease of $0.9 million, or 1.3%, from $74.2 million for fiscal year 2023. This decrease was primarily driven by the structure of our arrangements and the related timing of fulfilling performance obligations under the contracts. As a percentage of total revenue, professional services revenue decreased by 3.1 percentage points from 25.2% for fiscal year 2023 to 22.1% for fiscal year 2024.
Total Cost of Revenues and Gross Profits
The following table shows total cost of revenues by product type and the corresponding percentage change (dollars in thousands):
| Year Ended September 30, | % Change | % Change | |||||||||||||||||||||||||||
| 2025 | 2024 | 2023 | 2025 vs. 2024 | 2024 vs. 2023 | |||||||||||||||||||||||||
| License | $ | 6,941 | $ | 6,060 | $ | 8,522 | 14.5 | % | (28.9) | % | |||||||||||||||||||
| Connected services | 21,418 | 24,787 | 22,995 | (13.6) | % | 7.8 | % | ||||||||||||||||||||||
| Professional services | 40,286 | 56,282 | 63,232 | (28.4) | % | (11.0) | % | ||||||||||||||||||||||
| Amortization of intangibles | — | 103 | 414 | (100.0) | % | (75.1) | % | ||||||||||||||||||||||
| Total cost of revenues | $ | 68,645 | $ | 87,232 | $ | 95,163 | (21.3) | % | (8.3) | % | |||||||||||||||||||
The following table shows total gross profit by product type and the corresponding percentage change (dollars in thousands):
| Year Ended September 30, | % Change | % Change | |||||||||||||||||||||||||||
| 2025 | 2024 | 2023 | 2025 vs. 2024 | 2024 vs. 2023 | |||||||||||||||||||||||||
| License | $ | 133,684 | $ | 118,686 | $ | 136,637 | 12.6 | % | (13.1) | % | |||||||||||||||||||
| Connected services | 31,940 | 108,657 | 52,076 | (70.6) | % | 108.7 | % | ||||||||||||||||||||||
| Professional services | 17,512 | 17,032 | 11,013 | 2.8 | % | 54.7 | % | ||||||||||||||||||||||
| Amortization of intangibles | — | (103) | (414) | (100.0) | % | (75.1) | % | ||||||||||||||||||||||
| Total gross profit | $ | 183,136 | $ | 244,272 | $ | 199,312 | (25.0) | % | 22.6 | % | |||||||||||||||||||
Fiscal Year 2025 Compared with Fiscal Year 2024
Total cost of revenues for fiscal year 2025 was $68.6 million, a decrease of $18.6 million, or 21.3%, from $87.2 million for fiscal year 2024.
We experienced a decrease in total gross profit of $61.1 million, or 25.0%, from $244.3 million to $183.1 million. The decrease was primarily driven by the 2013 Nuance Legacy Contract Termination.
38
Cost of License Revenue
Cost of license revenue for fiscal year 2025 was $6.9 million, an increase of $0.9 million, or 14.5%, from $6.1 million for fiscal year 2024. Cost of license revenues increased primarily due to costs associated with our Cerence Link product. As a percentage of total cost of revenue, cost of license revenue increased by 3.2 percentage points from 6.9% for fiscal year 2024 to 10.1% for fiscal year 2025.
License gross profit increased by $15.0 million, or 12.6%, primarily due to increased license revenues.
Cost of Connected Services Revenue
Cost of connected services revenue for fiscal year 2025 was $21.4 million, a decrease of $3.4 million, or 13.6%, from $24.8 million for fiscal year 2024. Cost of connected services revenue decreased primarily due to a $1.4 million decrease from lower internal allocated labor, a $1.1 million decrease in our cloud infrastructure costs and a $0.4 million decrease in cost of goods sold. As a percentage of total cost of revenue, cost of connected service revenue increased by 2.8 percentage points from 28.4% for fiscal year 2024 to 31.2% for fiscal year 2025.
Connected services gross profit decreased $76.7 million, or 70.6%, from $108.7 million to $31.9 million which was primarily driven by the 2013 Nuance Legacy Contract Termination.
Cost of Professional Services Revenue
Cost of professional services revenue for fiscal year 2025 was $40.3 million, a decrease of $16.0 million, or 28.4%, from $56.3 million for fiscal year 2024. Cost of professional services revenue decreased primarily due to a $10.1 million decrease in third-party contractor costs, a $3.4 million decrease in allocated costs, and a $1.2 million decrease in compensation-related expenditures. Decreases were driven by the increased standardization of our software product offerings, which requires less professional services effort to implement, and other efficiencies in our professional services processes. As a percentage of total cost of revenue, cost of professional services revenue decreased by 5.8 percentage points from 64.5% for fiscal year 2024 to 58.7% for fiscal year 2025.
Professional services gross profit increased $0.5 million, or 2.8%, from $17.5 million to $17.0 million which was primarily due to decreases in compensation-related expenditures during fiscal year 2025.
Fiscal Year 2024 Compared with Fiscal Year 2023
Our total cost of revenues for fiscal year 2024 was $87.2 million, a decrease of $8.0 million, or 8.3%, from $95.2 million for fiscal year 2023.
We experienced an increase in gross profit of $45.0 million, or 22.6%, from $199.3 million to $244.3 million. The increase was primarily driven by the increase in connected service revenue due to the 2013 Nuance Legacy Contract Termination.
Cost of License Revenue
Cost of license revenue for fiscal year 2024 was $6.1 million, a decrease of $2.4 million, or 28.9%,, from $8.5 million for fiscal year 2023. Cost of license revenues decreased primarily due to costs associated with our Cerence Link product. As a percentage of total cost of revenue, cost of license revenue decreased by 2.1 percentage points from 9.0% for fiscal year 2023 to 6.9% for fiscal year 2024.
License gross profit decreased by $17.9 million, or 13.1%, from $136.6 million to $118.7 million, primarily due to decreases in license revenues.
Cost of Connected Services Revenue
Cost of connected services revenue for fiscal year 2024 was $24.8 million, an increase of $1.8 million, or 7.8%, from $23.0 million for fiscal year 2023. Cost of connected services revenue increased primarily due to a $1.6 million increase in our cloud infrastructure costs and a $1.0 million increase from higher internal allocated labor. The increase was partially offset by a $0.7 million decrease in salary-related expenditures. As a percentage of total cost of revenue, cost of connected service revenue increased by 4.2 percentage points from 24.2% for fiscal year 2023 to 28.4% for fiscal year 2024.
39
Connected services gross profit increased $56.6 million, or 108.7%, from $52.1 million to $108.7 million which was primarily driven by the 2013 Nuance Legacy Contract Termination.
Cost of Professional Services Revenue
Cost of professional services revenue for fiscal year 2024 was $56.3 million, a decrease of $6.9 million, or 11.0%, from $63.2 million for fiscal year 2023. Cost of professional services revenue decreased primarily due to a $3.9 million decrease in salary-related expenditures, a $1.4 million decrease in allocated costs, and a $0.9 million decrease in stock-based compensation expense. As a percentage of total cost of revenue, cost of professional services revenue decreased by 1.9 percentage points from 66.4% for fiscal year 2023 to 64.5% for fiscal year 2024.
Professional services gross profit increased $6.0 million, or 54.7%, from $11.0 million to $17.0 million which was primarily due to decreases in compensation-related expenditures during fiscal year 2024.
Operating Expenses
The tables below show each component of operating expense. Other income (expense), net and provision for income taxes are non-operating expenses and presented in a similar format (dollars in thousands).
R&D Expenses
| Year Ended September 30, | % Change | % Change | |||||||||||||||||||||||||||
| 2025 | 2024 | 2023 | 2025 vs. 2024 | 2024 vs. 2023 | |||||||||||||||||||||||||
| Research and development | $ | 97,756 | $ | 121,563 | $ | 123,333 | (19.6) | % | (1.4) | % | |||||||||||||||||||
Fiscal Year 2025 Compared with Fiscal Year 2024
Historically, R&D expenses are our largest operating expense as we continue to build on our existing software platforms and develop new technologies. R&D expenses for fiscal year 2025 were $97.8 million, a decrease of $23.8 million, or 19.6%, from $121.6 million for fiscal year 2024. The decrease in R&D expenses was primarily attributable to a $8.6 million decrease in third-party contractor costs, a $5.6 million decrease in employee compensation costs, a net $3.6 million decrease in internally allocated costs, a $0.4 million decrease in our cloud infrastructure costs, and a $6.3 million international tax credit catch-up related to two different tax jurisdictions; partially offset by $0.6 million in depreciation and amortization expense. As a percentage of total operating expenses, R&D expenses increased by 38.0 percentage points from 14.7% for fiscal year 2024 to 52.7% for fiscal year 2025.
Fiscal Year 2024 Compared with Fiscal Year 2023
Historically, R&D expenses are our largest operating expense as we continue to build on our existing software platforms and develop new technologies. R&D expenses for fiscal year 2024 were $121.6 million, a decrease of $1.7 million, or 1.4%, from $123.3 million for fiscal year 2023. The decrease in R&D expenses was primarily attributable to a $6.7 million decrease in stock-based compensation costs, a $1.1 million decrease in allocated costs, a $1.1 million R&D international tax credit refund, and a $1.0 million decrease in internally allocated labor. The decrease was partially offset by a $4.3 million increase in salary-related expenditures, a $2.3 million increase in third-party contractor costs, and a $0.9 million decrease in capitalized costs associated with internally developed software. As a percentage of total operating expenses, R&D expenses decreased by 39.7 percentage points from 54.4% for fiscal year 2023 to 14.7% for fiscal year 2024.
Sales & Marketing Expenses
| Year Ended September 30, | % Change | % Change | |||||||||||||||||||||||||||
| 2025 | 2024 | 2023 | 2025 vs. 2024 | 2024 vs. 2023 | |||||||||||||||||||||||||
| Sales and marketing | $ | 21,815 | $ | 21,725 | $ | 27,504 | 0.4 | % | (21.0) | % | |||||||||||||||||||
40
Fiscal Year 2025 Compared with Fiscal Year 2024
Sales and marketing expenses for fiscal year 2025 were $21.8 million, an increase of $0.1 million, or 0.4%, from $21.7 million for fiscal year 2024. As a percentage of total operating expenses, sales and marketing expenses increased by 9.1 percentage points from 2.6% for fiscal year 2024 to 11.8% for fiscal year 2025.
Fiscal Year 2024 Compared with Fiscal Year 2023
Sales and marketing expenses for fiscal year 2024 were $21.7 million, a decrease of $5.8 million, or 21.0%, from $27.5 million for fiscal year 2023. The decrease in sales and marketing expenses was primarily attributable to a $3.0 million decrease in salary-related expenditures, a $1.3 million decrease in stock-based compensation costs, a $1.0 million decrease in allocated costs, and a $1.1 million decrease in professional services. The decrease was partially offset by a $0.6 million increase in commissions expenditures. As a percentage of total operating expenses, sales and marketing expenses decreased by 9.5 percentage points from 12.1% for fiscal year 2023 to 2.6% for fiscal year 2024.
General & Administrative Expenses
| Year Ended September 30, | % Change | % Change | |||||||||||||||||||||||||||
| 2025 | 2024 | 2023 | 2025 vs. 2024 | 2024 vs. 2023 | |||||||||||||||||||||||||
| General and administrative | $ | 48,770 | $ | 52,468 | $ | 57,903 | (7.0) | % | (9.4) | % | |||||||||||||||||||
Fiscal Year 2025 Compared with Fiscal Year 2024
General and administrative expenses for fiscal year 2025 were $48.8 million, a decrease of $3.7 million, or 7.0%, from $52.5 million for fiscal year 2024. The decrease in general and administrative expenses was primarily attributable to a $3.3 million decrease in bad debt expense, a $1.9 million decrease in employee compensation-related expenditures, and a $0.7 million decrease in rent and utilities expenses. The decrease was partially offset by $2.0 million less costs being allocated out. As a percentage of total operating expenses, general and administrative expenses increased by 19.9 percentage points from 6.4% for fiscal year 2024 to 26.3% for fiscal year 2025.
Fiscal Year 2024 Compared with Fiscal Year 2023
General and administrative expenses for fiscal year 2024 were $52.5 million, a decrease of $5.4 million, or 9.4%, from $57.9 million for fiscal year 2023. The decrease in general and administrative expenses was primarily attributable to a $8.1 million decrease in stock-based compensation costs, a $1.9 million decrease in depreciation expense, a $1.3 million decrease in rent expense, and a $0.7 million decrease in salary-related expenditures. The decrease was partially offset by $3.9 million less costs being allocated out, a $2.0 million increase in professional services and a $0.6 million increase in hardware and software expenditures. As a percentage of total operating expenses, general and administrative expenses decreased by 19.2 percentage points from 25.6% for fiscal year 2023 to 6.4% for fiscal year 2024.
Amortization of Intangible Assets
| Year Ended September 30, | % Change | % Change | |||||||||||||||||||||||||||
| 2025 | 2024 | 2023 | 2025 vs. 2024 | 2024 vs. 2023 | |||||||||||||||||||||||||
| Cost of revenues | $ | — | $ | 103 | $ | 414 | (100.0) | % | (75.1) | % | |||||||||||||||||||
| Operating expense | 1,668 | 2,203 | 5,854 | (24.3) | % | (62.4) | % | ||||||||||||||||||||||
| Total amortization | $ | 1,668 | $ | 2,306 | $ | 6,268 | (27.7) | % | (63.2) | % | |||||||||||||||||||
Fiscal Year 2025 Compared with Fiscal Year 2024
Intangible asset amortization for fiscal year 2025 was $1.7 million, a decrease of $0.6 million, or 27.7%, from $2.3 million for fiscal year 2024. The decrease primarily relates to certain intangible assets having been fully amortized during fiscal years 2025 and 2024.
As a percentage of total cost of revenues, intangible asset amortization within cost of revenues decreased by 0.1 percentage points from 0.1% for fiscal year 2024 to none for fiscal year 2025. As a percentage of total operating
41
expenses, intangible asset amortization expenses within operating expenses increased by 0.6 percentage points from 0.3% for fiscal year 2024 to 0.9% for fiscal year 2025.
Fiscal Year 2024 Compared with Fiscal Year 2023
Intangible asset amortization for fiscal year 2024 was $2.3 million, a decrease of $4.0 million, or 63.2%, from $6.3 million for fiscal year 2023. The decrease primarily relates to certain intangible assets having been fully amortized during fiscal year 2024.
As a percentage of total cost of revenues, intangible asset amortization within cost of revenues decreased by 0.3 percentage points from 0.4% for fiscal year 2023 to 0.1% for fiscal year 2024. As a percentage of total operating expenses, intangible asset amortization expenses within operating expenses decreased by 2.3 percentage points from 2.6% for fiscal year 2023 to 0.3% for fiscal year 2024.
Other Components of Operating Expense
| Year Ended September 30, | % Change | % Change | |||||||||||||||||||||||||||
| 2025 | 2024 | 2023 | 2025 vs. 2024 | 2024 vs. 2023 | |||||||||||||||||||||||||
| Restructuring and other costs, net | $ | 15,418 | $ | 17,077 | $ | 11,917 | (9.7) | % | 43.3 | % | |||||||||||||||||||
| Goodwill impairment | $ | — | $ | 609,172 | $ | — | 100.0 | % | — | % | |||||||||||||||||||
Fiscal Year 2025 Compared with Fiscal Year 2024
Fiscal Year 2025
For the fiscal year ended September 30, 2025, we recorded restructuring and other costs, net of $15.4 million, which included a $12.1 million severance charge related to the elimination of personnel, of which $3.0 million related to the stock-based compensation expense for the termination of former senior management employees, and a $3.3 million charge related to our transformation initiatives. We are focused on pursuing actions intended to position the Company to deliver on our generative AI and large language model product roadmap and also deliver improved financial results which include process optimization efforts and cost reductions.
Fiscal Year 2024
Goodwill impairment for the fiscal year ended September 30, 2024 was $609.2 million. At March 31, 2024, we concluded indicators of impairment were present due to the current macroeconomic conditions, including declines in our stock price. The fair value of our reporting unit was determined using a combination of the income approach and the market approach. We weighted the methodologies appropriately to estimate a fair value of approximately $463.4 million as of March 31, 2024. The carrying value of our reporting unit exceeded the estimated fair value. Based upon the results of the impairment test, we recorded a goodwill impairment charge of $252.1 million during the three months ended March 31, 2024.
At June 30, 2024, we concluded indicators of impairment were present due to the current macroeconomic conditions, including declines in our stock price. The fair value of our reporting unit was determined using a combination of the income approach and the market approach. We weighted the methodologies appropriately to estimate a fair value of approximately $154.2 million as of June 30, 2024. The carrying value of our reporting unit exceeded the estimated fair value. Based upon the results of the impairment test, we recorded a goodwill impairment charge of $357.1 million during the three months ended June 30, 2024.
On July 1, 2024, we concluded that a quantitative goodwill impairment test is not necessary as of July 1, 2024, as the June 30, 2024 quantitative analysis is deemed applicable.
Based upon the results of the above impairment tests, our goodwill impairment charges total $609.2 million on the Consolidated Statement of Operations for the fiscal year ended September 30, 2024.
Whenever events or changes in circumstances indicate that the carrying value may not be recoverable, we will be required to assess the potential impairment of goodwill and other intangible assets. Examples of factors that could trigger an impairment of such assets include, but are not limited to, our market capitalization declining to below net book value, declines in our stock price for sustained periods of time and negative industry or economic trends. Future adverse changes in these or other unforeseeable factors could result in additional impairment charges that would impact our results of operations and financial position in the reporting period identified.
42
For the fiscal year ended September 30, 2024, we recorded restructuring and other costs, net of $17.1 million, which included a $13.4 million severance charge related to the elimination of personnel, of which $8.1 million related to the 2024 Plan, $2.8 million of consulting costs relating to our transformation initiatives, and $0.8 million of other one-time charges. We are focused on pursuing actions intended to position the Company to deliver on our generative AI and large language model product roadmap and also deliver improved financial results which include process optimization efforts and cost reductions.
As a percentage of total operating expense, restructuring and other costs, net increased by 6.2 percentage points from 2.1% for fiscal year 2024 to 8.3% for fiscal year 2025.
Fiscal Year 2024 Compared with Fiscal Year 2023
Restructuring and other costs, net for fiscal year 2024 were $17.1 million, an increase of $5.2 million, from $11.9 million for fiscal year 2023. The increase in restructuring and other costs, net was primarily due to a $13.4 million severance charge related to the elimination of personnel, of which $8.1 million related to the 2024 Plan, $2.8 million of consulting costs relating to our transformation initiatives, and $0.8 million of other one-time charges. As a percentage of total operating expense, restructuring and other costs, net decreased by 3.2 percentage points from 5.3% for fiscal year 2023 to 2.1% for fiscal year 2024.
Total Other Expense, Net
| Year Ended September 30, | % Change | % Change | |||||||||||||||||||||||||||
| 2025 | 2024 | 2023 | 2025 vs. 2024 | 2024 vs. 2023 | |||||||||||||||||||||||||
| Interest income | $ | 3,853 | $ | 5,353 | $ | 4,471 | (28.0) | % | 19.7 | % | |||||||||||||||||||
| Interest expense | (10,223) | (12,553) | (14,769) | (18.6) | % | (15.0) | % | ||||||||||||||||||||||
| Other income (expense), net | (160) | 2,526 | 1,108 | (106.3) | % | 128.0 | % | ||||||||||||||||||||||
| Total other expense, net | $ | (6,530) | $ | (4,674) | $ | (9,190) | 39.7 | % | (49.1) | % | |||||||||||||||||||
Fiscal Year 2025 Compared with Fiscal Year 2024
Total other expense, net for fiscal year 2025 was $6.5 million, a change of $1.9 million from $4.7 million of expense for fiscal year 2024. The decrease in interest income was primarily attributable to a reduction of balances generating interest. The decrease in interest expense was primarily attributable to a lower applicable interest rate on our Notes. The change in other income (expense), net was primarily driven by a $2.4 million write down of investments in convertible notes in fiscal year 2025, offset by foreign exchange gains.
Fiscal Year 2024 Compared with Fiscal Year 2023
Total other expense, net for fiscal year 2024 was $4.7 million, a change of $4.5 million from $9.2 million of expense for fiscal year 2023. The increase in interest income was primarily attributable to returns on investments. The decrease in interest expense was primarily attributable to a lower applicable interest rate on our Notes. The change in other income (expense), net, was primarily driven by foreign exchange gains.
Provision for Income Taxes
| Year Ended September 30, | % Change | % Change | |||||||||||||||||||||||||||
| 2025 | 2024 | 2023 | 2025 vs. 2024 | 2024 vs. 2023 | |||||||||||||||||||||||||
| Provision for income taxes | $ | 9,893 | $ | 3,468 | $ | 19,865 | 185.3 | % | (82.5) | % | |||||||||||||||||||
| Effective income tax rate % | (112.2) | % | (0.6) | % | (54.6) | % | |||||||||||||||||||||||
Fiscal Year 2025 Compared with Fiscal Year 2024
Our effective income tax rate for fiscal year 2025 was negative 112.2%, compared to negative 0.6% for fiscal year 2024. Consequently, our provision for income taxes for fiscal year 2025 was $9.9 million, an increase of $6.4 million, or 185.3%, from a provision for income taxes of $3.5 million for fiscal year 2024. The effective tax rate for the fiscal year 2025
43
differed from the U.S. federal statutory rate of 21.0%, primarily due to the tax impacts of stock-based compensation, research credits, and our composition of jurisdictional earnings.
Fiscal Year 2024 Compared with Fiscal Year 2023
Our effective income tax rate for fiscal year 2024 was negative 0.6% , compared to negative 54.6% for fiscal year 2023. Consequently, our provision for income taxes for fiscal year 2024 was $3.5 million, a decrease of $16.4 million, or 82.5%, from a provision for income taxes of $19.9 million for fiscal year 2023. The effective income tax rate for fiscal year 2024 differed from the U.S. federal statutory rate of 21.0%, primarily due to impairment of book goodwill, the tax impacts of stock-based compensation, U.S. inclusions of foreign taxable income, valuation allowance on foreign loss carryforwards, and our composition of jurisdictional earnings.
Liquidity and Capital Resources
Financial Condition
As of September 30, 2025, we had $87.5 million in cash, cash equivalents, and marketable securities. Cash equivalents include highly liquid investments that are readily convertible to known amounts of cash and have original maturities of three months or less. Marketable securities include corporate bonds, and government securities.
Sources and Material Cash Requirements
Our principal sources of liquidity are our cash, cash equivalents, and marketable securities, as well as the cash flows we generate from our operations. The primary uses of cash include costs of revenues, funding of R&D activities, capital expenditures and debt obligations.
Our ability to fund future operating needs will depend on our ability to generate positive cash flows from operations and access additional funding in the capital and debt markets as needed. Based on our expectations to generate positive cash flows and the $87.5 million of cash, cash equivalents and marketable securities as of September 30, 2025, we believe that we will be able to meet our liquidity needs over the next 12 months. We that believe we will meet longer-term expected future cash requirements and obligations, through a combination of cash flows from operating activities and available cash balances.
The following table presents our material cash requirements for future periods (dollars in thousands):
| Material Cash Requirements Due by the Year Ended September 30, | ||||||||||||||||||||||||||||||||
| 2026 | 2027 - 2028 | 2029 - 2030 | Thereafter | Total | ||||||||||||||||||||||||||||
| 2028 Notes | $ | — | $ | 122,500 | $ | — | $ | — | $ | 122,500 | ||||||||||||||||||||||
Cash interest payable on the 2028 Notes (a) | 1,838 | 3,675 | — | — | 5,513 | |||||||||||||||||||||||||||
| 2025 Modified Notes | — | 87,500 | — | — | 87,500 | |||||||||||||||||||||||||||
Cash interest payable on the 2025 Modified Notes (a) | 1,313 | 2,625 | — | — | 3,938 | |||||||||||||||||||||||||||
| Operating leases | 5,581 | 10,102 | 4,293 | 110 | 20,086 | |||||||||||||||||||||||||||
| Finance leases | 53 | — | — | — | 53 | |||||||||||||||||||||||||||
| Total material cash requirements | $ | 8,784 | $ | 226,402 | $ | 4,293 | $ | 110 | $ | 239,589 | ||||||||||||||||||||||
(a)Interest per annum is due and payable semiannually and is determined based on the outstanding principal as of September 30, 2025.
We sponsor certain defined benefit plans that are offered primarily by certain of our foreign subsidiaries. Many of these plans are required by local regulatory requirements. We may deposit funds for these plans with insurance companies, third-party trustees, or into government-managed accounts consistent with local regulatory requirements, as applicable. The aggregate net liability of our defined benefit plans as of September 30, 2025 was $6.2 million.
Should we need to secure additional sources of liquidity, we believe that we could finance our needs through the issuance of equity securities or debt offerings. However, we cannot guarantee that we will be able to obtain financing through the issuance of equity securities or debt offerings or that, if such financing is obtained, that it will be on acceptable terms. Our ability to issue debt or enter into other financing arrangements on acceptable terms could be adversely affected if there is a material decline in the demand for our products or in the solvency of our customers or suppliers or if there are other significantly unfavorable changes in economic conditions. For instance, inflation and
44
persistently high interest rates, changes in the political, legal and regulatory environment, including trade policies and tariffs, and disruptions have negatively impacted the global economy and created significant volatility and disruption of financial markets. An extended period of economic disruption or market volatility could materially affect our business, results of operations, access to sources of liquidity and financial condition.
1.50% Senior Convertible Notes due 2028
On June 26, 2023, we issued $190.0 million in aggregate principal amount of 1.50% Convertible Senior Notes due 2028 (the “2028 Notes”), which are governed by an indenture (the “2028 Indenture”), between us and U.S. Bank Trust Company, National Association, as trustee (the “Trustee”), in a private offering to qualified institutional buyers pursuant to Rule 144A under the Securities Act of 1933, as amended (the “Securities Act”). On July 3, 2023, we issued an additional $20.0 million in aggregate principal amount of 2028 Notes. The initial net proceeds from the issuance of the 2028 Notes were $193.2 million after deducting transaction costs.
The 2028 Notes are senior, unsecured obligations and accrue interest payable semiannually in arrears on January 1 and July 1 of each year at a rate of 1.50% per year. The 2028 Notes will mature on July 1, 2028, unless earlier converted, redeemed, or repurchased. The 2028 Notes are convertible into cash, shares of our common stock or a combination of cash and shares of our common stock, at our election.
A holder of 2028 Notes may convert all or any portion of its 2028 Notes at its option at any time prior to the close of business on the business day immediately preceding April 3, 2028 only under the following circumstances: (1) during any fiscal quarter commencing after the fiscal quarter ending on September 30, 2023 (and only during such fiscal quarter), if the last reported sale price of our common stock for at least 20 trading days (whether or not consecutive) during a period of 30 consecutive trading days ending on, and including, the last trading day of the immediately preceding fiscal quarter is greater than or equal to 130% of the conversion price on each applicable trading day; (2) during the five business day period after any ten consecutive trading day period (the “measurement period”) in which the “trading price” (as defined in the 2028 Indenture) per $1,000 principal amount of 2028 Notes for each trading day of the measurement period was less than 98% of the product of the last reported sale price of our common stock and the conversion rate on each such trading day; (3) if we call such 2028 Notes for redemption, at any time prior to the close of business on the business day immediately preceding the redemption date; or (4) upon the occurrence of specified corporate events. On or after April 3, 2028 until the close of business on the second scheduled trading day immediately preceding the maturity date, a holder may convert all or any portion of its 2028 Notes at any time, regardless of the foregoing circumstances.
The conversion rate is 24.5586 shares of our common stock per $1,000 principal amount of 2028 Notes (equivalent to an initial conversion price of approximately $40.72 per share of our common stock). The conversion rate is subject to adjustment in some events but will not be adjusted for any accrued and unpaid interest. In addition, following certain corporate events that occur prior to the maturity date or if we deliver a notice of redemption, we will, in certain circumstances, increase the conversion rate for a holder who elects to convert its 2028 Notes in connection with such a corporate event or convert its 2028 Notes called for redemption in connection with such notice of redemption, as the case may be.
We may not redeem the 2028 Notes prior to July 6, 2026. We may redeem for cash all or any portion of the 2028 Notes (subject to certain limitations), at our option, on a redemption date occurring on or after July 6, 2026 and on or before the 31st scheduled trading day immediately before the maturity date, if the last reported sale price of our common stock has been at least 130% of the conversion price then in effect for at least 20 trading days (whether or not consecutive), including the trading day immediately preceding the date on which we provide notice of redemption, during any 30 consecutive trading day period ending on, and including, the trading day immediately preceding the date on which we provide notice of redemption at a redemption price equal to 100% of the principal amount of the notes to be redeemed, plus accrued and unpaid interest to, but excluding, the redemption date. No sinking fund is provided for the 2028 Notes.
If we undergo a “fundamental change”, subject to certain conditions, holders may require us to repurchase for cash all or any portion of their 2028 Notes at a fundamental change repurchase price equal to 100% of the principal amount of the 2028 Notes to be repurchased, plus any accrued and unpaid interest to, but excluding, the fundamental change repurchase date.
The 2028 Indenture contains customary terms and covenants, including that upon certain events of default occurring, and continuing, either the Trustee or the holders of not less than 25% in aggregate principal amount of the 2028 Notes then outstanding may declare the entire principal amount of all the 2028 Notes plus accrued special interest, if any, to be immediately due and payable.
In connection with the offering of the 2028 Notes, we repurchased $87.5 million in aggregate principal amount of the 2025 Notes in a privately negotiated transaction. We specifically negotiated the repurchase of the 2025
45
Notes with investors who concurrently purchased the 2028 Notes. We evaluated the transaction to determine whether the exchange should be accounted for as a modification or extinguishment under the provisions of ASC 470-50, which allows for an exchange of debt instruments between the same debtor and creditor to be accounted for as a modification so long as the instruments do not have substantially different terms. Because the concurrent redemption of the 2025 Notes and a portion of issuance of the 2028 Notes were executed with the same investors, we evaluated the transaction as a debt modification, on a creditor by creditor basis. The repurchase of the 2025 Notes and issuance of the 2028 Notes were deemed to not have substantially different terms on the basis that (1) the present value of the cash flows under the terms of the new debt instrument were less than 10% different from the present value of the remaining cash flows under the terms of the original instrument and (2) the fair value of the conversion feature did not change by more than 10% of the carrying value of the 2025 Notes, and therefore, the repurchase of the 2025 Notes was accounted for as a debt modification.
As a result, $87.5 million of the 2028 Notes are considered a modification of the 2025 Notes and are included in the balances of the 2025 Notes (the “2025 Modified Notes” and together with the 2028 Notes, the “Notes”) that were not repurchased as part of the transaction. We recorded $14.3 million of fees paid directly to the lenders as deferred debt issuance costs, and $3.8 million of fees paid to third-parties were expensed in the period. As of September 30, 2025, the carrying amount of the 2025 Modified Notes was $78.5 million, net of unamortized costs of $9.0 million.
If a convertible debt instrument is modified or exchanged in a transaction that is not accounted for as an extinguishment, an increase in the fair value of the embedded conversion option shall reduce the carrying amount of the debt instrument with a corresponding increase in Additional paid-in capital. We recognized the increase in the fair value of the embedded conversion feature of $4.1 million as Additional paid-in capital and an equivalent discount that reduced the carrying value of the 2025 Modified Notes.
We accounted for $122.5 million of the 2028 Notes that were not negotiated with the investors of the 2025 Notes, as a single liability. We incurred transaction costs of $2.4 million relating to the issuance of the 2028 Notes, which were recorded as a direct deduction from the face amount of the 2028 Notes and are being amortized as interest expense over the term of the 2028 Notes using the interest method. As of September 30, 2025, the carrying amount of the 2028 Notes was $121.2 million and unamortized issuance costs of $1.3 million. As of September 30, 2025, the 2028 Notes were not convertible. As of September 30, 2025 and September 30, 2024, the if-converted value of the 2028 Notes was $85.0 million and $113.0 million, respectively, less than its principal amount.
3.00% Senior Convertible Notes due 2025
On June 2, 2020, we issued $175.0 million in aggregate principal amount of 3.00% Convertible Senior Notes due 2025 (the “2025 Notes”), including the initial purchasers’ exercise in full of their option to purchase $25.0 million principal amount of the 2025 Notes, which are governed by an indenture (the “2025 Indenture”), between us and the Trustee, in a private offering to qualified institutional buyers pursuant to Rule 144A under the Securities Act of 1933, as amended. The net proceeds from the issuance of the 2025 Notes were $169.8 million after deducting transaction costs.
The 2025 Notes were senior, unsecured obligations and accrued interest payable semiannually in arrears on June 1 and December 1 of each year, at a rate of 3.00% per year.
During the year ended September 30, 2025, we repurchased $27.4 million aggregate principal amount of our 2025 Notes for $27.0 million million in cash, including accrued interest and fees, via privately negotiated transactions with certain holders. The repurchased notes were subsequently cancelled and retired, resulting in a gain on extinguishment of debt of $0.3 million. The remaining outstanding principal balance on the 2025 Notes and accrued interest of $61.0 million was repaid in its entirety at maturity during the three months ended June 30, 2025.
See “1.50% Senior Convertible Notes due 2028” section above for discussion on modification of the 2025 Notes as part of the offering of the 2028 Notes.
The interest expense recognized related to the Notes for the fiscal years ended September 30, 2025, 2024 and 2023 was as follows (dollars in thousands):
| Year Ended September 30, | |||||||||||||||||
| 2025 | 2024 | 2023 | |||||||||||||||
| Contractual interest expense | $ | 4,547 | $ | 5,776 | $ | 5,383 | |||||||||||
| Amortization of debt discount | 916 | 1,019 | 258 | ||||||||||||||
| Amortization of issuance costs | 4,289 | 4,936 | 2,119 | ||||||||||||||
| Total interest expense related to the Notes | $ | 9,752 | $ | 11,731 | $ | 7,760 | |||||||||||
46
Senior Credit Facilities
On June 12, 2020, we entered into the Term Loan Facility. The net proceeds from the issuance of the Term Loan Facility were $123.0 million. We also entered into the Revolving Facility, which could have been drawn on in the event that our working capital and other cash needs were not supported by our operating cash flow. In connection with the issuance of the 2028 Notes, in the third quarter of fiscal year 2023, we borrowed $24.7 million under our Revolving Facility and paid $106.3 million towards our Term Loan Facility. As a result, we recorded $104.9 million extinguishment of debt and $1.3 million loss on the extinguishment of debt. All principal and interest on the Term Loan Facility have been paid in full.
On December 31, 2024, we terminated the Credit Agreement. On the date of termination, there were no revolving loans outstanding under the Credit Agreement. As a result of the Credit Agreement termination, we will not have access to the Revolving Facility and we will not be subject to the applicable Credit Agreement covenants.
Total interest expense relating to the Senior Credit Facilities for the fiscal years ended September 30, 2025, 2024 and 2023 were 0.4 million, $0.4 million, $6.7 million, respectively, reflecting the coupon and accretion of the discount.
Cash Flows
Cash flows from operating, investing and financing activities for the fiscal years ended September 30, 2025, 2024, and 2023, as reflected in the audited Consolidated Statements of Cash Flows included in Item 8 of this Form 10-K, are summarized in the following table (dollars in thousands):
| Year Ended September 30, | % Change | % Change | ||||||||||||||||||||||||||||||
| 2025 | 2024 | 2023 | 2025 vs. 2024 | 2024 vs. 2023 | ||||||||||||||||||||||||||||
| Net cash provided by operating activities | $ | 61,173 | $ | 17,196 | $ | 7,498 | 255.7 | % | 129.4 | % | ||||||||||||||||||||||
| Net cash (used in) provided by investing activities | (10,554) | 4,379 | 5,820 | (341.0) | % | (24.8) | % | |||||||||||||||||||||||||
| Net cash (used in) provided by financing activities | (87,001) | 225 | (5,334) | (38767.1) | % | (104.2) | % | |||||||||||||||||||||||||
| Effect of foreign currency exchange rates on cash and cash equivalents | (1,086) | (1,469) | (1,677) | (26.1) | % | (12.4) | % | |||||||||||||||||||||||||
| Net changes in cash and cash equivalents | $ | (37,468) | $ | 20,331 | $ | 6,307 | (284.3) | % | 222.4 | % | ||||||||||||||||||||||
Net Cash Provided By Operating Activities
Fiscal Year 2025 Compared with Fiscal Year 2024
Net cash provided by operating activities for fiscal year 2025 was $61.2 million, a net change of $44.0 million, or 255.7%, from net cash provided by operating activities of $17.2 million for fiscal year 2024. The change in cash flows were primarily due to:
•A decrease of $34.2 million from income before non-cash charges;
•A decrease of $6.2 million due to changes in working capital primarily related to prepaid expenses and other assets and accrued expenses and other liabilities; and
•An increase of $84.3 million from changes in deferred revenue.
Deferred revenue represents a significant portion of our net cash provided by operating activities and, depending on the nature of our contracts with customers and foreign currency exchange rates, this balance can fluctuate significantly from period to period. Fluctuations in deferred revenue are not a reliable indicator of future performance and the related revenue associated with these contractual commitments. We do not expect any changes in deferred revenue to affect our ability to meet our obligations.
47
Fiscal Year 2024 Compared with Fiscal Year 2023
Net cash provided by operating activities for fiscal year 2024 was $17.2 million, a net change of $9.7 million, or 129.4%, from net cash provided by operating activities of $7.5 million for fiscal year 2023. The change in cash flows were primarily due to:
•An increase of $49.6 million from income before non-cash charges;
•A decrease of $0.4 million due to changes in working capital primarily related to accounts receivable and prepaid expenses and other assets and accounts payable; and
•A decrease of $39.5 million from changes in deferred revenue.
Net Cash (Used In) Provided By Investing Activities
Fiscal Year 2025 Compared with Fiscal Year 2024
Net cash used in investing activities for the fiscal year 2025 was $10.6 million, a net change of $14.9 million, or 341.0%, from net cash provided by investing activities of $4.4 million for fiscal year 2024. The change in cash flows were driven by an increase in capital expenditures of $9.4 million and a decrease of $5.6 million in net proceeds from the sale of marketable securities.
Fiscal Year 2024 Compared with Fiscal Year 2023
Net cash provided by investing activities for fiscal year 2024 was $4.4 million, a net change of $1.4 million, or 24.8%, from net cash provided by investing activities of $5.8 million for fiscal year 2023. The change in cash flows were driven by a decrease of $1.2 million net proceeds from the purchase and sale of marketable securities.
Net Cash (Used In) Provided By Financing Activities
Fiscal Year 2025 Compared with Fiscal Year 2024
Net cash used in financing activities for the fiscal year 2025 was $87.0 million, a net change of $87.2 million, or 38767.1% from cash provided by financing activities of $0.2 million for fiscal year 2024. The change in cash flows were primarily due to:
•An increase of $87.1 million in principal payments of short-term debt;
•A decrease of $0.4 million in payments for long-term debt issuance costs;
•A decrease of $8.0 million in proceeds from the issuance of our common stock; and
•A decrease of $7.5 million in payments of tax related withholdings due to the net settlement of equity awards.
Fiscal Year 2024 Compared with Fiscal Year 2023
Net cash provided by financing activities for fiscal year 2024 was $0.2 million, a net change of $5.5 million, or 104.2%, from cash used in financing activities of 5.3 million for fiscal year 2023. The change in cash flows were primarily due to:
•A decrease of $210.0 million in proceeds from long-term debt;
•A decrease of $198.4 million in principal payments of long-term debt;
•A decrease of $16.8 million in payments for long-term debt issuance costs;
•An increase of $5.3 million in proceeds from the issuance of our common stock; and
•An increase of $5.0 million in payments of tax related withholdings due to the net settlement of equity awards.
48
Issued Accounting Standards Not Yet Adopted
Refer to Note 2 to the accompanying audited Consolidated Financial Statements included elsewhere in this Annual Report on Form 10-K for a description of certain issued accounting standards that have not been adopted by us and may impact our results of operations in future reporting periods.
Critical Accounting Estimates
The preparation of financial statements in conformity with GAAP, requires management to make estimates and assumptions that have a material impact on the reported amounts of assets and liabilities, and the disclosure of contingent assets and liabilities at the date of the financial statements, and the reported amounts of revenue and expenses during the reporting period. On an ongoing basis, we evaluate our estimates, including those related to revenue recognition; allowance for credit losses; accounting for deferred costs; accounting for internally developed software; the valuation of goodwill and intangible assets; accounting for stock-based compensation; accounting for income taxes; accounting for convertible debt; and loss contingencies. Our management bases its estimates on historical experience, market participant fair value considerations, projected future cash flows, and various other factors that are believed to be reasonable under the circumstances. Actual results could differ from these estimates.
We believe the following critical accounting estimates most significantly affect the portrayal of our financial condition and the results of our operations. These estimates require our most difficult and subjective judgments.
Revenue Recognition
We primarily derive revenue from the following sources: (1) royalty-based software or IP license arrangements, (2) connected services, and (3) professional services. Revenue is reported net of applicable sales and use tax, value-added tax and other transaction taxes imposed on the related transaction including mandatory government charges that are passed through to our customers. We account for a contract when both parties have approved and committed to the contract, the rights of the parties are identified, payment terms are identified, the contract has commercial substance and collectability of consideration is probable.
Our arrangements with customers may contain multiple products and services. We account for individual products and services separately if they are distinct—that is, if a product or service is separately identifiable from other items in the contract and if a customer can benefit from it on its own or with other resources that are readily available to the customer.
We recognize revenue after applying the following five steps for arrangements with customers within the scope of ASC 606:
•identification of the contract, or contracts, with a customer;
•identification of the performance obligations in the contract, including whether they are distinct within the context of the contract;
•determination of the transaction price, including the constraint on variable consideration;
•allocation of the transaction price to the performance obligations in the contract; and
•recognition of revenue when, or as, the performance obligations are satisfied.
We allocate the transaction price of the arrangement based on the relative estimated standalone selling price (“SSP”) of each distinct performance obligation. In determining SSP, we maximize observable inputs, when possible. Since prices vary from customer to customer based on customer relationship, volume discount and contract type, in instances where the SSP is not directly observable, we estimate SSP by considering a number of data points, including cost of developing and supplying each performance obligation; types of offerings; and gross margin objectives and pricing practices, such as contractually stated prices, discounts offered, and applicable price lists.
We only include estimated amounts in the transaction price to the extent it is probable that a significant reversal of cumulative revenue recognized will not occur when the uncertainty associated with the variable consideration is resolved. When allocating the transaction price under ASC 606, estimates related to variable consideration, which are typically related to usage-based volume estimates, are evaluated based on various assessments such as historical data, current market conditions and other relevant factors. Other forms of contingent revenue or variable consideration are infrequent.
49
Revenue is recognized when control of these products or services is transferred to our customers, in an amount that reflects the consideration we expect to be entitled to in exchange for those products or services.
We assess the timing of the transfer of products or services to the customer as compared to the timing of payments to determine whether a significant financing component exists. In accordance with the practical expedient in ASC 606-10-32-18, we do not assess the existence of a significant financing component when the difference between payment and transfer of deliverables is a year or less. If the difference in timing arises for reasons other than the provision of finance to either the customer or us, no financing component is deemed to exist. The primary purpose of our invoicing terms is to provide customers with simplified and predictable ways of purchasing our services, not to receive or provide financing from or to customers. We do not consider set-up fees nor other upfront fees paid by our customers to represent a financing component.
Reimbursements for out-of-pocket costs generally include, but are not limited to, costs related to transportation, lodging and meals. When applicable, revenue from reimbursed out-of-pocket costs is accounted for as variable consideration.
Performance Obligations
License
Embedded software and technology licenses operate without access to external networks and information. Embedded licenses sold with non-distinct professional services to customize and/or integrate the underlying software and technology are accounted for as a combined performance obligation. Revenue from the combined performance obligation is recognized over time based upon the progress towards completion of the project, which is measured based on the labor hours already incurred to date as compared to the total estimated labor hours.
Revenue from distinct embedded software and technology licenses, which do not require professional services to customize and/or integrate the software license, is recognized at the point in time when the software and technology is made available to the customer and control is transferred. For income statement presentation purposes, we separate distinct embedded license revenue from professional services revenue by allocating the transaction price based on their relative SSPs.
Revenue from embedded software and technology licenses sold on a royalty basis, where the license of non-exclusive intellectual property is the predominant item to which the royalty relates, is recognized in the period the usage occurs in accordance with ASC 606-10-55-65(A).
For royalty arrangements that include fixed consideration related to usage guarantees, the fixed consideration is recognized when the software is made available to the customer.
Connected Services
Connected services, which allow our customers to use the hosted software over the contract period without taking possession of the software, are provided on a usage basis as consumed or on a fixed fee subscription basis. Our connected services contract terms generally range from one to five years.
As each day of providing services is substantially the same and the customer simultaneously receives and consumes the benefits as access is provided, we have determined that our usage basis connected services arrangements are a single performance obligation comprised of a series of distinct services. These services include variable consideration, typically a function of usage. We recognize revenue as each distinct service period is performed (i.e., recognized as incurred).
Fixed fee subscription basis revenue represents a single promise to stand-ready to provide access to our connected services. We recognize revenue over time on a ratable basis over the respective hosting subscription term.
Our connected service arrangements generally include services to develop, customize, and stand-up applications for each customer. In determining whether these services are distinct, we consider the dependence of the cloud service on the up-front development and stand-up, as well as availability of the services from other vendors. We have concluded that the up-front development, stand-up and customization services are not distinct performance obligations, and as such, revenue for these activities is recognized over the period during which the cloud-connected services are provided, and is included within connected services revenue. There can be instances where the customer purchases a software license that allows them to take possession of the software to enable hosting by the customer or a third-party. For such arrangements, the performance obligation of the license is completed at a point in time once the customer takes possession of the software.
50
Professional Services
Revenue from distinct professional services, including training, is recognized over time based upon the progress towards completion of the project, which is measured based on the labor hours already incurred to date as compared to the total estimated labor hours.
Significant Judgments
Determining whether products and services are considered distinct performance obligations that should be accounted for separately versus together may require significant judgment. Our license contracts often include professional services to customize and/or integrate the licenses into the customer’s environment. Judgment is required to determine whether the license is considered distinct and accounted for separately, or not distinct and accounted for together with professional services. Furthermore, hybrid contracts that contain both embedded and connected license and professional services are analyzed to determine if the products and services are distinct or have stand-alone functionality to determine the revenue treatment.
We allocate the transaction price of the arrangement based on the relative estimated SSP of each distinct performance obligation. Judgment is required to determine the SSP for each distinct performance obligation. In determining SSP, we maximize observable inputs, when possible. Since our prices vary from customer to customer based on customer relationship, volume discount and contract type, there are instances where the SSP is not directly observable. In such instances, we estimate SSP by considering a number of data points, including cost of developing and supplying each performance obligation; types of offerings; and gross margin objectives and pricing practices, such as contractually stated prices, discounts offered, and applicable price lists. These factors may vary over time, depending upon the unique facts and circumstances related to each deliverable. We review the SSP for each distinct performance obligation on a periodic basis, or when the underlying factors are deemed to have changed, and make updates when appropriate.
Contract Acquisition Costs
We are required to capitalize certain contract acquisition costs. The capitalized costs primarily relate to paid commissions. In accordance with the practical expedient in ASC 606-10-10-4, we apply a portfolio approach to estimate contract acquisition costs for groups of customer contracts. We elect to apply the practical expedient in ASC 340-40-25-4 and will expense contract acquisition costs as incurred where the expected period of benefit is one year or less. Contract acquisition costs are deferred and amortized on a straight-line basis over the period of benefit, which we have estimated to be between one and eight years. The period of benefit was determined based on an average customer contract term, expected contract renewals, changes in technology and our ability to retain customers, including canceled contracts. We assess the amortization term for all major transactions based on specific facts and circumstances. Contract acquisition costs are classified as current or noncurrent assets based on when the expense will be recognized. The current and noncurrent portions of contract acquisition costs are included in Prepaid expenses and other current assets and in Other assets, respectively.
Capitalized Contract Costs
We capitalize incremental costs incurred to fulfill our contracts that (i) relate directly to the contract, (ii) are expected to generate resources that will be used to satisfy our performance obligation under the contract, and (iii) are expected to be recovered through revenue generated under the contract. Our capitalized costs consist primarily of setup costs, such as costs to standup, customize and develop applications for each customer, which are incurred to satisfy our stand-ready obligation to provide access to our connected offerings. These contract costs are expensed to cost of revenue as we satisfy our stand-ready obligation over the contract term which we estimate to be between one and eight years, on average. The contract term was determined based on an average customer contract term, expected contract renewals, changes in technology, and our ability to retain customers, including canceled contracts. We classify these costs as current or noncurrent based on the timing of when we expect to recognize the expense. The current and noncurrent portions of capitalized contract fulfillment costs are presented as Deferred costs.
Trade Accounts Receivable and Contract Balances
We classify our right to consideration in exchange for deliverables as either a receivable or a contract asset. A receivable is a right to consideration that is unconditional (i.e., only the passage of time is required before payment is due). We present such receivables in Accounts receivable, net in our Consolidated Balance Sheets at their net estimated realizable value. We maintain an allowance for credit losses to provide for the estimated amount of receivables that may not be collected.
51
Our contract assets and liabilities are reported in a net position on a contract-by-contract basis at the end of each reporting period. Contract assets include unbilled amounts from long-term contracts when revenue recognized exceeds the amount billed to the customer, and right to payment is not solely subject to the passage of time. The current and noncurrent portions of contract assets are included in Prepaid expenses and other current assets and Other assets, respectively.
Our contract liabilities, or deferred revenue, consist of advance payments and billings in excess of revenues recognized. We classify deferred revenue as current or noncurrent based on when we expect to recognize the revenues.
Goodwill Impairment Analysis
Goodwill represents the excess of the purchase price in a business combination over the fair value of net tangible and intangible assets acquired. Goodwill is not amortized but tested annually for impairment or when indicators of impairment are present. The test for goodwill impairment involves a qualitative assessment of impairment indicators. If indicators are present, a quantitative test of impairment is performed. Goodwill impairment, if any, is determined by comparing the reporting unit’s fair value to its carrying value. An impairment loss is recognized in an amount equal to the excess of the reporting unit’s carrying value over its fair value, up to the amount of goodwill allocated to the reporting unit. Goodwill is tested for impairment annually on July 1, the first day of the fourth quarter of the fiscal year. There was no goodwill impairment for the fiscal years ending September 30, 2025 and 2023.
For the purpose of testing goodwill for impairment, all goodwill acquired in a business combination is assigned to one or more reporting units. A reporting unit represents an operating segment or a component within an operating segment for which discrete financial information is available and is regularly reviewed by segment management for performance assessment and resource allocation. Components of similar economic characteristics are aggregated into one reporting unit for the purpose of goodwill impairment assessment. Reporting units are identified annually and re-assessed periodically for recent acquisitions or any changes in segment reporting structure. Upon consideration of our components, we have concluded that our goodwill is associated with one reporting unit.
The fair value of a reporting unit is generally determined using a combination of the income approach and the market approach. For the income approach, fair value is determined based on the present value of estimated future after-tax cash flows, discounted at an appropriate risk-adjusted rate. We use our internal forecasts to estimate future after-tax cash flows and estimate the long-term growth rates based on our most recent views of the long-term outlook for each reporting unit. Actual results may differ from those assumed in our forecasts. We derive our discount rates using a capital asset pricing model and analyzing published rates for industries relevant to our reporting units to estimate the weighted average cost of capital. We adjust the discount rates for the risks and uncertainty inherent in the respective businesses and in our internally developed forecasts. For the market approach, we use a valuation technique in which values are derived based on valuation multiples of comparable publicly traded companies. We assess each valuation methodology based upon the relevance and availability of the data at the time we perform the valuation and weight the methodologies appropriately.
At March 31, 2024, we concluded indicators of impairment were present due to the current macroeconomic conditions, including declines in our stock price. The fair value of our reporting unit was determined using a combination of the income approach and the market approach. We weighted the methodologies appropriately to estimate a fair value of approximately $463.4 million as of March 31, 2024. The carrying value of our reporting unit exceeded the estimated fair value. Based upon the results of the impairment test, we recorded a goodwill impairment charge of $252.1 million during the three months ended March 31, 2024.
At June 30, 2024, we concluded indicators of impairment were present due to the current macroeconomic conditions, including declines in our stock price. The fair value of our reporting unit was determined using a combination of the income approach and the market approach. We weighted the methodologies appropriately to estimate a fair value of approximately $154.2 million as of June 30, 2024. The carrying value of our reporting unit exceeded the estimated fair value. Based upon the results of the impairment test, we recorded a goodwill impairment charge of $357.1 million during the three months ended June 30, 2024.
On July 1, 2024, we concluded that a quantitative goodwill impairment test is not necessary as of July 1, 2024, as the June 30, 2024 quantitative analysis is deemed applicable.
Based upon the results of the above impairment tests, our goodwill impairment charges total $609.2 million on the Consolidated Statement of Operations for the fiscal year ended September 30, 2024.
52
Long-Lived Assets with Definite Lives
Our long-lived assets consist principally of technology and patents, customer relationships, internally developed software, land, building, and equipment. Customer relationships are amortized over their estimated economic lives based on the pattern of economic benefits expected to be generated from the use of the asset. Other definite-lived assets are amortized over their estimated economic lives using the straight-line method. The remaining useful lives of long-lived assets are re-assessed periodically at the asset group level for any events and circumstances that may change the future cash flows expected to be generated from the long-lived asset or asset group.
Internally developed software consists of capitalized costs incurred during the application development stage, which include costs related to the design of the software configuration and interfaces, coding, installation and testing. Costs incurred during the preliminary project stage and post-implementation stage are expensed as incurred. Internally developed software is amortized over the estimated useful life, commencing on the date when the asset is ready for its intended use. Land, building and equipment are stated at cost and depreciated over their estimated useful lives. Leasehold improvements are depreciated over the shorter of the related lease term or the estimated useful life. Depreciation is computed using the straight-line method. Repair and maintenance costs are expensed as incurred. The cost and related accumulated depreciation of sold or retired assets are removed from the accounts and any gain or loss is included in the results of operations for the period.
Long-lived assets with definite lives are tested for impairment whenever events or changes in circumstances indicate the carrying value of a specific asset or asset group may not be recoverable. We assess the recoverability of long-lived assets with definite lives at the asset group level. Asset groups are determined based upon the lowest level for which identifiable cash flows are largely independent of the cash flows of other assets and liabilities. When the asset group is also a reporting unit, goodwill assigned to the reporting unit is also included in the carrying amount of the asset group. For the purpose of the recoverability test, we compare the total undiscounted future cash flows from the use and disposition of the assets with its net carrying amount. When the carrying value of the asset group exceeds the undiscounted future cash flows, the asset group is deemed to be impaired. The amount of the impairment loss represents the excess of the asset or asset group’s carrying value over its estimated fair value, which is generally determined based upon the present value of estimated future pre-tax cash flows that a market participant would expect from use and disposition of the long-lived asset or asset group. There were no long-lived asset impairments in any of the periods presented.
Stock-Based Compensation
We grant equity awards to certain employees which include stock options and restricted stock unit awards in accordance with provisions of the Cerence 2019 Equity Incentive Plan (“Equity Incentive Plan”).
We account for stock-based compensation through recognition of the fair value of the stock-based compensation as a charge against earnings. The fair value for time-based restricted stock units and performance-based restricted stock units is based on the closing share price of our common stock on the date of grant. For performance-based restricted stock units, the compensation cost is recognized based on the number of units expected to vest upon the achievement of the performance conditions. We recognize stock-based compensation as an expense on a straight-line basis, over the requisite service period. We account for forfeitures as they occur, rather than applying an estimated forfeiture rate.
Income Taxes
We account for income taxes using the assets and liabilities method, as prescribed by ASC No. 740, Income Taxes, or ASC 740.
Deferred Taxes
Deferred tax assets and liabilities are recognized for the estimated future tax consequences attributable to differences between the financial statement carry amount of assets and liabilities and their respective tax bases. The method also requires the recognition of future tax benefits such as net operating loss carryforwards, to the extent that realization of such benefits is more likely than not after consideration of all available evidence. As the income tax returns are not due and filed until after the completion of our annual financial reporting requirements, the amounts recorded for the current period reflect estimates for the tax-based activity for the period. In addition, estimates are often required with respect to, among other things, the appropriate state and foreign income tax rates to use, the potential utilization of operating loss carry-forwards and valuation allowance required, if any, for tax assets that may not be realizable in the future. Tax laws and tax rates vary substantially in these jurisdictions and are subject to change given the political and economic climate. We report
53
and pay income tax based on operational results and applicable law. Our tax provision contemplates tax rates currently enacted to determine both our current and deferred tax positions.
Any significant fluctuations in rates or changes in tax laws could cause our estimates of taxes we anticipate either paying or recovering in the future to change. Such changes could lead to either increases or decreases in our effective tax rates.
We have historically estimated the future tax consequences of certain items, including credit losses and accruals that cannot be deducted for income tax purposes until such expenses are paid or the related assets are disposed. We believe the procedures and estimates used in our accounting for income taxes are reasonable and in accordance with established tax law. The income tax estimates used have not resulted in material adjustments to income tax expense in subsequent period when the estimates are adjusted to the actual filed tax return amounts.
Deferred tax assets and liabilities are measured used enacted tax rates expected to apply to taxable income in the fiscal years in which those temporary differences are expected to be recovered or settled. With respect to earnings expected to be indefinitely reinvested offshore, we do not accrue tax for the repatriations of such foreign earnings.
Valuation Allowance
We regularly review our deferred tax assets for recoverability considering historically profitability, projected future taxable income, the expected timing of the reversals of existing temporary differences and tax planning strategies. In assessing the need for a valuation allowance, we consider both positive and negative evidence related to the likelihood of realization of the deferred tax assets. The weight given to the positive and negative evidence is commensurate with the extent to which the evidence may be objectively verified. If positive evidence regarding projected future taxable income, exclusive of reversing taxable temporary differences, existed it would be difficult for it to outweigh objective negative evidence of recent financial reporting losses.
We will continue to maintain a valuation allowance against these deferred tax assets until we believe it is more likely than not that they will be realized. If sufficient positive evidence arises in the future indicating that all or a portion of the deferred tax assets meet the more likely than not standard, the valuation allowance would be reversed accordingly in the period that such determination is made.
Uncertain Tax Positions
We operate in multiple jurisdictions through wholly owned subsidiaries and our global structure is complex. The estimates of our uncertain tax positions involve judgments and assessment of the potential tax implications related to legal entity restructuring, intercompany transfers and acquisitions or divestitures. We recognize tax benefits from uncertain tax positions only if it is more likely than not that the tax position will be sustained on examination by the taxing authorities, based on the technical merits of the position. Our tax positions are subject to audit by taxing authorities across multiple global jurisdictions and the resolution of such audits may span multiple years. Tax laws are complex and often subject to varied interpretations, accordingly, the ultimate outcome with respect to taxes we may own may differ from the amounts recognized.
Convertible Debt
We adopted ASU 2020-06 on October 1, 2022. Since the adoption of ASU 2020-06, we record our convertible debt at face value less unamortized issuance costs. Issuance costs are amortized to Interest expense in our Consolidated Statements of Operations using the effective interest method over the contractual term of the convertible debt. We assess the short-term and long-term classification of our convertible debt on each balance sheet date. Whenever the holders have a contractual right to convert, the carrying amount of the convertible debt is reclassified to current liabilities.
Prior to the adoption of ASU 2020-06: (i) we bifurcate the debt and equity (the contingently convertible feature) components of our convertible debt instruments in a manner that reflects our nonconvertible debt borrowing rate at the time of issuance; (ii) the equity components of our convertible debt instruments were recorded within stockholders’ equity with an allocated issuance premium or discount; and (iii) the debt issuance premium or discount was amortized to Interest expense in our Consolidated Statements of Operations using the effective interest method over the contractual term of the convertible debt. We assess the short-term and long-term classification of our convertible debt on each balance sheet date. Whenever the holders have a contractual right to convert, the carrying amount of the convertible debt is reclassified to current liabilities, with the corresponding equity component classified from additional paid-in capital to mezzanine equity, as needed.
54
Loss Contingencies
We may be subject to legal proceedings, lawsuits and other claims relating to labor, service, intellectual property, and other matters that arise from time to time in the ordinary course of business. On a quarterly basis, we review the status of each significant matter and assess our potential financial exposure. If the potential loss from any claim or legal proceeding is considered probable and the amount can be reasonably estimated, we accrue a liability for the estimated loss. Significant judgments are required for the determination of probability and the range of the outcomes. Due to the inherent uncertainties, estimates are based only on the best information available at the time. Actual outcomes may differ from our estimates. As additional information becomes available, we reassess the potential liability related to our pending claims and litigation and may revise our estimates. Such revisions may have a material impact on our results of operations and financial position.
Item 7A. Quantitative and Qualitative Disclosures About Market Risk.
We are exposed to market risk from changes in foreign currency exchange rates and interest rates which could affect operating results, financial position and cash flows. We manage our exposure to these market risks through our regular operating and financing activities, and through the use of derivative financial instruments.
Exchange Rate Sensitivity
We are exposed to changes in foreign currency exchange rates. Any foreign currency transaction, defined as a transaction denominated in a currency other than the local functional currency, will be reported in the functional currency at the applicable exchange rate in effect at the time of the transaction. A change in the value of the functional currency compared to the foreign currency of the transaction will have either a positive or negative impact on our financial position and results of operations.
Assets and liabilities of our foreign entities are translated into U.S. dollars at exchange rates in effect at the balance sheet date and income and expense items are translated at average rates for the applicable period. Therefore, the change in the value of the U.S. dollar compared to foreign currencies will have either a positive or negative effect on our financial position and results of operations. Historically, our primary exposure has been related to transactions denominated in the Canadian dollar, Chinese yuan, Euro, and Japanese yen.
We use foreign currency forward contracts to hedge the foreign currency exchange risk associated with forecasted foreign denominated payments related to our ongoing business. The aggregate notional amount of our outstanding foreign currency forward contracts was $16.7 million at September 30, 2025. Foreign currency forward contracts are sensitive to changes in foreign currency exchange rates. A 10% unfavorable exchange rate movement in our portfolio of foreign currency contracts would have resulted in unrealized losses of $1.7 million at September 30, 2025. Such losses would be offset by corresponding gains in the remeasurement of the underlying transactions being hedged. We believe these foreign currency forward exchange contracts and the offsetting underlying commitments, when taken together, do not create material market risk.
Interest Rate Sensitivity
We are exposed to interest rate risk as a result of our cash and cash equivalents.
At September 30, 2025, we held approximately $84.0 million of cash and cash equivalents consisting of cash and highly liquid investments, including money-market funds and time deposits. Assuming a 1% increase in interest rates, our interest income on our money-market funds and time deposits classified as cash and cash equivalents would increase by $0.2 million per annum, based on September 30, 2025 reported balances.
55
Item 8. Financial Statements and Supplementary Data.
INDEX TO CONSOLIDATED FINANCIAL STATEMENTS
56
Report of Independent Registered Public Accounting Firm
Shareholders and Board of Directors
Cerence Inc.
Burlington, Massachusetts
Opinion on the Consolidated Financial Statements
We have audited the accompanying consolidated balance sheets of Cerence Inc (the “Company”) as of September 30, 2025 and 2024, the related consolidated statements of operations and comprehensive loss, consolidated statements of equity, and consolidated cash flows for each of the three years in the period ended September 30, 2025, and the related notes (collectively referred to as the “consolidated financial statements”). In our opinion, the consolidated financial statements present fairly, in all material respects, the financial position of the Company at September 30, 2025 and 2024, and the results of its operations and its cash flows for each of the three years in the period ended September 30, 2025, in conformity with accounting principles generally accepted in the United States of America.
We also have audited, in accordance with the standards of the Public Company Accounting Oversight Board (United States) (“PCAOB”), the Company's internal control over financial reporting as of September 30, 2025, based on criteria established in Internal Control – Integrated Framework (2013) issued by the Committee of Sponsoring Organizations of the Treadway Commission (“COSO”) and our report dated November 20, 2025 expressed an unqualified opinion thereon.
Basis for Opinion
These consolidated financial statements are the responsibility of the Company’s management. Our responsibility is to express an opinion on the Company’s consolidated financial statements based on our audits. We are a public accounting firm registered with the Public Company Accounting Oversight Board (United States) (“PCAOB”) and are required to be independent with respect to the Company in accordance with the U.S. federal securities laws and the applicable rules and regulations of the Securities and Exchange Commission and the PCAOB.
We conducted our audits in accordance with the standards of the PCAOB. Those standards require that we plan and perform the audit to obtain reasonable assurance about whether the consolidated financial statements are free of material misstatement, whether due to error or fraud.
Our audits included performing procedures to assess the risks of material misstatement of the consolidated financial statements, whether due to error or fraud, and performing procedures that respond to those risks. Such procedures included examining, on a test basis, evidence regarding the amounts and disclosures in the consolidated financial statements. Our audits also included evaluating the accounting principles used and significant estimates made by management, as well as evaluating the overall presentation of the consolidated financial statements. We believe that our audits provide a reasonable basis for our opinion.
Critical Audit Matters
The critical audit matter communicated below is a matter arising from the current period audit of the consolidated financial statements that was communicated or required to be communicated to the audit committee and that: (1) relates to accounts or disclosures that are material to the consolidated financial statements and (2) involved our especially challenging, subjective, or complex judgments. The communication of the critical audit matter does not alter in any way our opinion on the consolidated financial statements, taken as a whole, and we are not, by communicating the critical audit matter below, providing separate opinions on the critical audit matter or on the accounts or disclosures to which it relates.
Identification of Performance Obligations
As described in Note 3 to the Company’s consolidated financial statements, certain of the Company’s revenue contracts contain multiple products and services relating to the sale of connected or embedded licenses and professional services. For these revenue contracts, the Company accounts for the individual products and services separately if they are distinct. The transaction price is allocated to the performance obligations based on their relative standalone selling prices.
We determined the identification of distinct performance obligations in the recognition of revenue related to contracts that contain multiple products or services as a critical audit matter. The determination of whether multiple products or services within a contract are distinct performance obligations that should be accounted for separately requires
57
management to exercise significant judgment and includes a high degree of subjectivity. Auditing the identification of distinct performance obligations in certain revenue contracts involved especially challenging auditor judgment due to the nature and extent of audit effort required to address this matter.
The primary procedures we performed to address this critical audit matter included:
•Evaluating the design and testing operating effectiveness of certain controls relating to management’s identification and assessment of distinct performance obligations in contracts with customers.
•Evaluating management’s technical accounting policies and practices including the reasonableness of management’s judgments and assumptions in the determination of whether the products and services represent distinct performance obligations.
•Testing the reasonableness of the identification of distinct performance obligations through inspection of a selection of customer contracts and other source documents.
/s/ BDO USA, P.C.
We have served as the Company’s auditor since 2017.
November 20, 2025
58
Report of Independent Registered Public Accounting Firm
Shareholders and Board of Directors
Cerence Inc.
Burlington, Massachusetts
Opinion on Internal Control over Financial Reporting
We have audited Cerence Inc.’s (the “Company’s”) internal control over financial reporting as of September 30, 2025, based on criteria established in Internal Control – Integrated Framework (2013) issued by the Committee of Sponsoring Organizations of the Treadway Commission (the “COSO criteria”). In our opinion, the Company maintained, in all material respects, effective internal control over financial reporting as of September 30, 2025, based on the COSO criteria.
We also have audited, in accordance with the standards of the Public Company Accounting Oversight Board (United States) (“PCAOB”), the consolidated balance sheets of the Company as of September 30, 2025 and 2024, the related consolidated statements of operations and comprehensive loss, consolidated statements of equity, and consolidated cash flows for each of the three years in the period ended September 30, 2025, and the related notes and our report dated November 20, 2025 expressed an unqualified opinion thereon.
Basis for Opinion
The Company’s management is responsible for maintaining effective internal control over financial reporting and for its assessment of the effectiveness of internal control over financial reporting, included in the accompanying Item 9A, Management’s Report on Internal Control over Financial Reporting. Our responsibility is to express an opinion on the Company’s internal control over financial reporting based on our audit. We are a public accounting firm registered with the PCAOB and are required to be independent with respect to the Company in accordance with U.S. federal securities laws and the applicable rules and regulations of the Securities and Exchange Commission and the PCAOB.
We conducted our audit of internal control over financial reporting in accordance with the standards of the PCAOB. Those standards require that we plan and perform the audit to obtain reasonable assurance about whether effective internal control over financial reporting was maintained in all material respects. Our audit included obtaining an understanding of internal control over financial reporting, assessing the risk that a material weakness exists, and testing and evaluating the design and operating effectiveness of internal control based on the assessed risk. Our audit also included performing such other procedures as we considered necessary in the circumstances. We believe that our audit provides a reasonable basis for our opinion.
Definition and Limitations of Internal Control over Financial Reporting
A company’s internal control over financial reporting is a process designed to provide reasonable assurance regarding the reliability of financial reporting and the preparation of financial statements for external purposes in accordance with generally accepted accounting principles. A company’s internal control over financial reporting includes those policies and procedures that (1) pertain to the maintenance of records that, in reasonable detail, accurately and fairly reflect the transactions and dispositions of the assets of the company; (2) provide reasonable assurance that transactions are recorded as necessary to permit preparation of financial statements in accordance with generally accepted accounting principles, and that receipts and expenditures of the company are being made only in accordance with authorizations of management and directors of the company; and (3) provide reasonable assurance regarding prevention or timely detection of unauthorized acquisition, use, or disposition of the company’s assets that could have a material effect on the financial statements.
Because of its inherent limitations, internal control over financial reporting may not prevent or detect misstatements. Also, projections of any evaluation of effectiveness to future periods are subject to the risk that controls may become inadequate because of changes in conditions, or that the degree of compliance with the policies or procedures may deteriorate.
/s/ BDO USA, P.C.
Boston, Massachusetts
November 20, 2025
59
CERENCE INC.
CONSOLIDATED STATEMENTS OF OPERATIONS
(In thousands, except per share data)
| Year Ended September 30, | |||||||||||||||||
| 2025 | 2024 | 2023 | |||||||||||||||
| Revenues: | |||||||||||||||||
| License | $ | $ | $ | ||||||||||||||
| Connected services | |||||||||||||||||
| Professional services | |||||||||||||||||
| Total revenues | |||||||||||||||||
| Cost of revenues: | |||||||||||||||||
| License | |||||||||||||||||
| Connected services | |||||||||||||||||
| Professional services | |||||||||||||||||
| Amortization of intangible assets | |||||||||||||||||
| Total cost of revenues | |||||||||||||||||
| Gross profit | |||||||||||||||||
| Operating expenses: | |||||||||||||||||
| Research and development | |||||||||||||||||
| Sales and marketing | |||||||||||||||||
| General and administrative | |||||||||||||||||
| Amortization of intangible assets | |||||||||||||||||
| Restructuring and other costs, net | |||||||||||||||||
| Goodwill impairment | |||||||||||||||||
| Total operating expenses | |||||||||||||||||
| Loss from operations | ( | ( | ( | ||||||||||||||
| Interest income | |||||||||||||||||
| Interest expense | ( | ( | ( | ||||||||||||||
| Other (expense) income, net | ( | ||||||||||||||||
| Loss before income taxes | ( | ( | ( | ||||||||||||||
| Provision for income taxes | |||||||||||||||||
| Net loss | $ | ( | $ | ( | $ | ( | |||||||||||
| Net loss per share: | |||||||||||||||||
| Basic | $ | ( | $ | ( | $ | ( | |||||||||||
| Diluted | $ | ( | $ | ( | $ | ( | |||||||||||
| Weighted-average common share outstanding: | |||||||||||||||||
| Basic | |||||||||||||||||
| Diluted | |||||||||||||||||
Refer to accompanying Notes to the Consolidated Financial Statements.
60
CERENCE INC.
CONSOLIDATED STATEMENTS OF COMPREHENSIVE LOSS
(In thousands)
| Year Ended September 30, | |||||||||||||||||
| 2025 | 2024 | 2023 | |||||||||||||||
| Net loss | $ | ( | $ | ( | $ | ( | |||||||||||
| Other comprehensive income (loss): | |||||||||||||||||
| Foreign currency translation adjustments | ( | ||||||||||||||||
| Pension adjustments, net | ( | ( | |||||||||||||||
| Unrealized (loss) gain on available-for-sale securities | ( | ||||||||||||||||
| Total other comprehensive income (loss) | |||||||||||||||||
| Comprehensive loss | $ | ( | $ | ( | $ | ( | |||||||||||
Refer to accompanying Notes to the Consolidated Financial Statements.
61
CERENCE INC.
CONSOLIDATED BALANCE SHEETS
(In thousands, except per share amounts)
| September 30, 2025 | September 30, 2024 | ||||||||||
| ASSETS | |||||||||||
| Current assets: | |||||||||||
| Cash and cash equivalents | $ | $ | |||||||||
| Marketable securities | |||||||||||
Accounts receivable, net of allowances of $ | |||||||||||
| Deferred costs | |||||||||||
| Prepaid expenses and other current assets | |||||||||||
| Total current assets | |||||||||||
| Long-term marketable securities | |||||||||||
| Property and equipment, net | |||||||||||
| Deferred costs | |||||||||||
| Operating lease right of use assets | |||||||||||
| Goodwill | |||||||||||
| Intangible assets, net | |||||||||||
| Deferred tax assets | |||||||||||
| Other assets | |||||||||||
| Total assets | $ | $ | |||||||||
| LIABILITIES AND STOCKHOLDERS' EQUITY | |||||||||||
| Current liabilities: | |||||||||||
| Accounts payable | $ | $ | |||||||||
| Deferred revenue | |||||||||||
| Short-term operating lease liabilities | |||||||||||
| Short-term debt | |||||||||||
| Accrued expenses and other current liabilities | |||||||||||
| Total current liabilities | |||||||||||
| Long-term debt, net of discounts and issuance costs | |||||||||||
| Deferred revenue, net of current portion | |||||||||||
| Long-term operating lease liabilities | |||||||||||
| Other liabilities | |||||||||||
| Total liabilities | |||||||||||
| Commitments and contingencies (Note 13) | |||||||||||
| Stockholders' Equity: | |||||||||||
Common stock, $ | |||||||||||
| Accumulated other comprehensive loss | ( | ( | |||||||||
| Additional paid-in capital | |||||||||||
| Accumulated deficit | ( | ( | |||||||||
| Total stockholders' equity | |||||||||||
| Total liabilities and stockholders' equity | $ | $ | |||||||||
Refer to accompanying Notes to the Consolidated Financial Statements.
62
CERENCE INC.
CONSOLIDATED STATEMENTS OF EQUITY
(In thousands)
| Common Stock | |||||||||||||||||||||||||||||||||||
| Shares | Amount | Additional Paid-In Capital | Retained Earnings (Accumulated Deficit) | Accumulated Other Comprehensive Income (Loss) | Total | ||||||||||||||||||||||||||||||
| Balance at September 30, 2022 | $ | $ | $ | ( | $ | ( | $ | ||||||||||||||||||||||||||||
| Net loss | — | — | — | ( | — | ( | |||||||||||||||||||||||||||||
| — | — | ( | — | ( | |||||||||||||||||||||||||||||||
| Other comprehensive income | — | — | — | — | |||||||||||||||||||||||||||||||
| Issuance of common stock | — | — | |||||||||||||||||||||||||||||||||
| Increase in fair value of conversion option | — | — | — | — | |||||||||||||||||||||||||||||||
| Stock withheld to cover tax withholdings requirements upon stock vesting | ( | ( | ( | — | — | ( | |||||||||||||||||||||||||||||
| Stock-based compensation | — | — | — | — | |||||||||||||||||||||||||||||||
| Balance at September 30, 2023 | ( | ( | |||||||||||||||||||||||||||||||||
| Net loss | — | — | — | ( | — | ( | |||||||||||||||||||||||||||||
| Other comprehensive income | — | — | — | — | |||||||||||||||||||||||||||||||
| Issuance of common stock | — | — | |||||||||||||||||||||||||||||||||
| Stock withheld to cover tax withholdings requirements upon stock vesting | ( | ( | — | — | ( | ||||||||||||||||||||||||||||||
| Stock-based compensation | — | — | — | — | |||||||||||||||||||||||||||||||
| Balance at September 30, 2024 | ( | ( | |||||||||||||||||||||||||||||||||
| Net loss | — | — | — | ( | - | ( | |||||||||||||||||||||||||||||
| Other comprehensive income | — | — | — | — | |||||||||||||||||||||||||||||||
| Issuance of common stock | — | - | |||||||||||||||||||||||||||||||||
| Stock withheld to cover tax withholdings requirements upon stock vesting | ( | — | ( | — | — | ( | |||||||||||||||||||||||||||||
| Stock-based compensation | — | — | — | — | |||||||||||||||||||||||||||||||
| Balance at September 30, 2025 | $ | $ | $ | ( | $ | ( | $ | ||||||||||||||||||||||||||||
Refer to accompanying Notes to the Consolidated Financial Statements.
63
CERENCE INC.
CONSOLIDATED STATEMENTS OF CASH FLOWS
(In thousands)
| Year Ended September 30, | |||||||||||||||||
| 2025 | 2024 | 2023 | |||||||||||||||
| Cash flows from operating activities: | |||||||||||||||||
| Net loss | $ | ( | $ | ( | $ | ( | |||||||||||
| Adjustments to reconcile net loss to net cash provided by (used in) operations: | |||||||||||||||||
| Depreciation and amortization | |||||||||||||||||
| Provision for credit loss reserve | |||||||||||||||||
| Stock-based compensation | |||||||||||||||||
| Non-cash interest expense | |||||||||||||||||
| (Gain) loss on debt extinguishment | ( | ||||||||||||||||
| Deferred tax provision (benefit) | ( | ||||||||||||||||
| Goodwill impairment | |||||||||||||||||
| Unrealized foreign currency transaction gain | ( | ( | ( | ||||||||||||||
| Other, net | ( | ( | |||||||||||||||
| Changes in operating assets and liabilities: | |||||||||||||||||
| Accounts receivable | ( | ( | |||||||||||||||
| Prepaid expenses and other assets | ( | ||||||||||||||||
| Deferred costs | |||||||||||||||||
| Accounts payable | ( | ( | |||||||||||||||
| Accrued expenses and other liabilities | ( | ( | |||||||||||||||
| Deferred revenue | ( | ( | |||||||||||||||
| Net cash provided by operating activities | |||||||||||||||||
| Cash flows from investing activities: | |||||||||||||||||
| Capital expenditures | ( | ( | ( | ||||||||||||||
| Purchases of marketable securities | ( | ||||||||||||||||
| Sale and maturities of marketable securities | |||||||||||||||||
| Other investing activities | ( | ( | ( | ||||||||||||||
| Net cash (used in) provided by investing activities | ( | ||||||||||||||||
| Cash flows from financing activities: | |||||||||||||||||
| Principal payments of short-term debt | ( | ||||||||||||||||
| Proceeds from revolving credit facility | |||||||||||||||||
| Payments of revolver credit facility | ( | ||||||||||||||||
| Proceeds from long-term debt, net of discount | |||||||||||||||||
| Payments for long-term debt issuance costs | ( | ( | |||||||||||||||
| Principal payments of long-term debt | ( | ||||||||||||||||
| Common stock repurchases for tax withholdings for net settlement of equity awards | ( | ( | ( | ||||||||||||||
| Principal payment of lease liabilities arising from a finance lease | ( | ( | ( | ||||||||||||||
| Proceeds from the issuance of common stock | |||||||||||||||||
| Net cash (used in) provided by financing activities | ( | ( | |||||||||||||||
| Effect of foreign currency exchange rates on cash and cash equivalents | ( | ( | ( | ||||||||||||||
| Net change in cash and cash equivalents | ( | ||||||||||||||||
| Cash and cash equivalents at beginning of period | |||||||||||||||||
| Cash and cash equivalents at end of period | $ | $ | $ | ||||||||||||||
| Supplemental information: | |||||||||||||||||
| Cash paid for income taxes | $ | $ | $ | ||||||||||||||
| Cash paid for interest | $ | $ | $ | ||||||||||||||
Refer to accompanying Notes to the Consolidated Financial Statements.
64
CERENCE INC.
NOTES TO THE CONSOLIDATED FINANCIAL STATEMENTS
1. Organization
History
On October 1, 2019, (the “Distribution Date”), Nuance Communications, Inc. (“Nuance” or “the Parent”), a leading provider of speech and language solutions for businesses and consumers around the world, completed the complete legal and structural separation and distribution to its stockholders of all of the outstanding shares of our common stock, and its consolidated subsidiaries, in a tax free spin-off (the “Spin-Off”). The distribution was made in the amount of one share of our common stock for every eight shares of Nuance common stock (the “Distribution”) owned by Nuance’s stockholders as of 5:00 p.m. Eastern Time on September 17, 2019, the record date of the Distribution.
In connection with the Distribution, on September 30, 2019, we filed an Amended and Restated Certificate of Incorporation with the Secretary of State of the State of Delaware, which became effective on October 1, 2019. Our Amended and Restated By-laws also became effective on October 1, 2019. On October 2, 2019, our common stock began regular-way trading on the Nasdaq Global Select Market under the ticker symbol CRNC.
Business
Cerence Inc. (referred to in this Annual Report on Form 10-K as “we,” “our,” “us,” “ourselves,” the “Company” or “Cerence”) is a global, premier provider of AI-powered assistants and innovations for connected and autonomous vehicles. Our customers include nearly all major automobile original equipment manufacturers (“OEMs”), or their tier 1 suppliers worldwide. We deliver our solutions on a white-label basis, enabling our customers to deliver customized virtual assistants with unique, branded personalities and ultimately strengthening the bond between automobile brands and end users. We generate revenue primarily by selling software licenses and cloud-connected services. In addition, we generate professional services revenue from our work with OEMs and suppliers during the design, development and deployment phases of the vehicle model lifecycle and through maintenance and enhancement projects.
2. Summary of Significant Accounting Policies
(a) Basis of Presentation
The accompanying consolidated financial statements of the Company have been prepared in accordance with accounting principles generally accepted in the United States (“GAAP”) and the rules and regulations of the Securities and Exchange Commission (“SEC”). The consolidated financial statements reflect all adjustments considered necessary for a fair presentation of the consolidated results of operations and financial position for the fiscal years presented. All such adjustments are of a normal recurring nature.
(b) Principles of Consolidation
The accompanying consolidated financial statements include the accounts of the Company, as well as those of our wholly owned subsidiaries. All significant intercompany transactions and balances are eliminated in consolidation.
(c) Use of Estimates
The Consolidated Financial Statements are prepared in accordance with GAAP, which requires management to make estimates and assumptions. These estimates, judgments and assumptions can affect the reported amounts in the financial statements and the footnotes thereto. Actual results could differ materially from these estimates. On an ongoing basis, we evaluate our estimates, assumptions and judgments. Significant estimates inherent to the preparation of financial statements include: revenue recognition; the allowances for credit losses; accounting for deferred costs; accounting for internally developed software; the valuation of goodwill and intangible assets; accounting for stock-based compensation; accounting for income taxes; accounting for leases; and loss contingencies. We base our estimates on historical experience, market participant fair value considerations, projected future cash flows, and various other factors that are believed to be reasonable under the circumstances. Actual amounts could differ significantly from these estimates.
65
(d) Revenue Recognition
(e) Cash and Cash Equivalents
Cash and cash equivalents include cash on hand and highly liquid investments that are readily convertible to known amounts of cash and have original maturities of three months or less.
(f) Marketable Securities
Marketable securities consist of commercial paper, government securities and corporate bonds. We classify our marketable securities as available-for-sale at the time of purchase and reevaluate such classification as of each balance sheet date. We may sell these securities at any time for use in current operations even if they have not yet reached maturity. We classify our marketable securities as either short-term or long-term based on the nature of each security. We record marketable securities at fair value, with the unrealized gains or losses included within Accumulated other comprehensive loss on the Consolidated Balance Sheets until realized. Interest income earned from our marketable securities is reported within Interest income on the Consolidated Statements of Operations. We evaluate our marketable securities to assess whether those with unrealized loss positions are other than temporarily impaired. We consider impairment to be other than temporary if it is related to deterioration in credit risk or if it is likely we will sell the securities before the recovery of their cost basis. Realized gains and losses and declines in value judged to be other than temporary are determined based on the specific identification method and are reported in Other income (expense), net on the Consolidated Statements of Operations.
(g) Inventory
(h) Goodwill
Goodwill represents the excess of the purchase price in a business combination over the fair value of net assets acquired. Goodwill is not amortized but tested annually for impairment or when indicators of impairment are present. The test for goodwill impairment involves a qualitative assessment of impairment indicators. If indicators are present, a quantitative test of impairment is performed. Goodwill impairment, if any, is determined by comparing the reporting unit’s fair value to its carrying value. An impairment loss is recognized in an amount equal to the excess of the reporting unit’s carrying value over its fair value, up to the amount of goodwill allocated to the reporting unit. Goodwill is tested for impairment annually on July 1, the first day of the fourth quarter of the fiscal year.
We believe our Chief Executive Officer (“CEO”) is our chief operating decision maker (“CODM”). Our CEO manages the business on a consolidated basis and regularly reviews consolidated financial information for the purposes of making operating decisions, assessing our financial performance and allocating resources. Accordingly, we have concluded that we have one operating segment.
For the purpose of testing goodwill for impairment, all goodwill acquired in a business combination is assigned to one or more reporting units. A reporting unit represents an operating segment or a component within an operating segment for which discrete financial information is available and is regularly reviewed by segment management for performance assessment and resource allocation. Components of similar economic characteristics are aggregated into one reporting unit for the purpose of goodwill impairment assessment. Reporting units are identified annually and re-assessed periodically for recent acquisitions or any changes in segment reporting structure. Upon consideration of our components, we have concluded that we have one reporting unit.
66
The fair value of a reporting unit is generally determined using a combination of the income approach and the market approach. For the income approach, fair value is determined based on the present value of estimated future after-tax cash flows, discounted at an appropriate risk-adjusted rate. We use our internal forecasts to estimate future after-tax cash flows and estimate the long-term growth rates based on our most recent views of the long-term outlook for each reporting unit. Actual results may differ from those assumed in our forecasts. We derive our discount rates using a capital asset pricing model and analyzing published rates for industries relevant to our reporting units to estimate the weighted average cost of capital. We adjust the discount rates for the risks and uncertainty inherent in the respective businesses and in our internally developed forecasts. For the market approach, we use a valuation technique in which values are derived based on valuation multiples of comparable publicly traded companies. We assess each valuation methodology based upon the relevance and availability of the data at the time we perform the valuation and weight the methodologies appropriately.
On July 1, 2025, we completed the annual impairment testing of our goodwill. We elected to rely on a qualitative assessment and as a result we determined it is more likely than not that the fair value of our reporting unit is greater than its carrying amount. Accordingly, no goodwill impairment was recorded for the fiscal year ended September 30, 2025.
At March 31, 2024, we concluded indicators of impairment were present due to the current macroeconomic conditions, including declines in our stock price. The fair value of our reporting unit was determined using a combination of the income approach and the market approach. We weighted the methodologies appropriately to estimate a fair value of approximately $463.4 million as of March 31, 2024. The carrying value of our reporting unit exceeded the estimated fair value. Based upon the results of the impairment test, we recorded a goodwill impairment charge of $252.1 million during the three months ended March 31, 2024.
At June 30, 2024, we concluded indicators of impairment were present due to the current macroeconomic conditions, including declines in our stock price. The fair value of our reporting unit was determined using a combination of the income approach and the market approach. We weighted the methodologies appropriately to estimate a fair value of approximately $154.2 million as of June 30, 2024. The carrying value of our reporting unit exceeded the estimated fair value. Based upon the results of the impairment test, we recorded a goodwill impairment charge of $357.1 million during the three months ended June 30, 2024.
On July 1, 2024, we concluded that a quantitative goodwill impairment test was not necessary as of July 1, 2024, as the June 30, 2024 quantitative analysis was deemed applicable.
Based upon the results of the above impairment tests, our goodwill impairment charges total $609.2 million on the Consolidated Statement of Operations for the fiscal year ended September 30, 2024.
On July 1, 2023, we completed the annual impairment testing of our goodwill. We elected to rely on a qualitative assessment and as a result we determined it is more likely than not that the fair value of our reporting unit is greater than its carrying amount.
(i) Segment Information
67
(j) Long-Lived Assets with Definite Lives
Our long-lived assets consist principally of technology and patents, customer relationships, internally developed software, property and equipment. Customer relationships are amortized over their estimated economic lives based on the pattern of economic benefits expected to be generated from the use of the asset. Other definite-lived assets are amortized over their estimated economic lives using the straight-line method. The remaining useful lives of long-lived assets are re-assessed periodically for any events and circumstances that may change the future cash flows expected to be generated from the long-lived asset or asset group.
Internally developed software consists of capitalized costs incurred during the application development stage, which include costs to design the software configuration and interfaces, coding, installation and testing. Costs incurred during the preliminary project stage, along with post-implementation stages of internally developed software, are expensed as incurred. Internally developed software costs that have been capitalized are typically amortized over the estimated useful life, commencing with the date when an asset is ready for its intended use. Equipment is stated at cost and depreciated over the estimated useful life. Leasehold improvements are depreciated over the shorter of the related remaining lease term or the estimated useful life. Depreciation is computed using the straight-line method. Repair and maintenance costs are expensed as incurred. The cost and related accumulated depreciation of sold or retired assets are removed from the accounts and any gain or loss is included in the results of operations for the period.
Long-lived assets with definite lives are tested for impairment whenever events or changes in circumstances indicate the carrying value of a specific asset or asset group may not be recoverable. We assess the recoverability of long-lived assets with definite lives at the asset group level. Asset groups are determined based upon the lowest level for which identifiable cash flows are largely independent of the cash flows of other assets and liabilities. When the asset group is also a reporting unit, goodwill assigned to the reporting unit is also included in the carrying amount of the asset group. For the purpose of the recoverability test, we compare the total undiscounted future cash flows from the use and disposition of the assets with its net carrying amount. When the carrying value of the asset group exceeds the undiscounted future cash flows, the asset group is deemed to be impaired. The amount of the impairment loss represents the excess of the asset or asset group’s carrying value over its estimated fair value, which is generally determined based upon the present value of estimated future pre-tax cash flows that a market participant would expect from use and disposition of the long-lived asset or asset group. There was no
(k) Allowance for Credit Losses
We are exposed to credit losses primarily through our sales of software licenses and services to customers. We determine credit ratings for each customer in our portfolio based upon public information and information obtained directly from our customers. A credit limit for each customer is established and in certain cases we may require collateral or prepayment to mitigate credit risk. Our expected loss methodology is developed using historical collection experience, current customer credit information, current and future economic and market conditions and a review of the current status of the customer's account balances. We monitor our ongoing credit exposure through reviews of customer balances against contract terms and due dates, current economic conditions, and dispute resolution. Estimated credit losses are written off in the period in which the financial asset is no longer collectible.
The change in the allowance for credit losses for the fiscal year ended September 30, 2025, 2024, and 2023 is as follows (dollars in thousands):
68
| Allowance for Credit Losses | |||||
| Balance as of September 30, 2022 | $ | ||||
| Credit loss provision | |||||
| Foreign exchange impact on ending balance | |||||
| Balance as of September 30, 2023 | |||||
| Credit loss provision | |||||
| Write-offs, net of recoveries | ( | ||||
| Foreign exchange impact on ending balance | |||||
| Balance as of September 30, 2024 | |||||
| Credit loss provision | |||||
| Write-offs, net of recoveries | ( | ||||
| Foreign exchange impact on ending balance | ( | ||||
| Balance as of September 30, 2025 | $ | ||||
(l) Research and Development
Research and development (“R&D”) costs related to software that is or will be sold or licensed externally to third-parties, or for which a substantive plan exists to sell or license such software in the future, incurred subsequent to the establishment of technological feasibility, but prior to the general release of the product, are capitalized and amortized to cost of revenue over the estimated useful life of the related products. We have determined that technological feasibility is reached shortly before the general release of the software products. Costs incurred after technological feasibility is established have not been material. R&D costs are otherwise expensed as incurred.
(m) Income Taxes
We account for income taxes using the assets and liabilities method, as prescribed by ASC No. 740, Income Taxes, or ASC 740.
Deferred Taxes
Deferred tax assets and liabilities are recognized for the estimated future tax consequences attributable to differences between the financial statement carrying amount of assets and liabilities and their respective tax bases. The method also requires the recognition of future tax benefits such as net operating loss carryforwards, to the extent that realization of such benefits is more likely than not after consideration of all available evidence. As the income tax returns are not due and filed until after the completion of our annual financial reporting requirements, the amounts recorded for the current period reflect estimates for the tax-based activity for the period. In addition, estimates are often required with respect to, among other things, the appropriate state and foreign income tax rates to use, the potential utilization of operating loss carry-forwards and valuation allowance required, if any, for tax assets that may not be realizable in the future. Tax laws and tax rates vary substantially in these jurisdictions and are subject to change given the political and economic climate. We report and pay income tax based on operational results and applicable law. Our tax provision contemplates tax rates currently enacted to determine both our current and deferred tax positions.
Any significant fluctuations in rates or changes in tax laws could cause our estimates of taxes we anticipate either paying or recovering in the future to change. Such changes could lead to either increases or decreases in our effective tax rates.
We have historically estimated the future tax consequences of certain items, including accruals that cannot be deducted for income tax purposes until such expenses are paid or the related assets are disposed. We believe the procedures and estimates used in our accounting for income taxes are reasonable and in accordance with established tax law. The income tax estimates used have not resulted in material adjustments to income tax expense in subsequent period when the estimates are adjusted to the actual filed tax return amounts.
Deferred tax assets and liabilities are measured using enacted tax rates expected to apply to taxable income in the fiscal years in which those temporary differences are expected to be recovered or settled. With respect to earnings expected to be indefinitely reinvested offshore, we do not
69
Valuation Allowance
We regularly review our deferred tax assets for recoverability considering historical profitability, projected future taxable income, the expected timing of the reversals of existing temporary differences and tax planning strategies. In assessing the need for a valuation allowance, we consider both positive and negative evidence related to the likelihood of realization of the deferred tax assets. The weight given to the positive and negative evidence is commensurate with the extent to which the evidence may be objectively verified. If positive evidence regarding projected future taxable income, exclusive of reversing taxable temporary differences, existed it would be difficult for it to outweigh objective negative evidence of recent financial reporting losses.
Uncertain Tax Positions
We operate in multiple jurisdictions through wholly owned subsidiaries and our global structure is complex. The estimates of our uncertain tax positions involve judgments and assessment of the potential tax implications related to legal entity restructuring, intercompany transfers and acquisitions or divestitures. We recognize tax benefits from uncertain tax positions only if it is more likely than not that the tax position will be sustained on examination by the taxing authorities, based on the technical merits of the position. Our tax positions are subject to audit by taxing authorities across multiple global jurisdictions and the resolution of such audits may span multiple years. Tax laws are complex and often subject to varied interpretations, accordingly, the ultimate outcome with respect to taxes we may owe may differ from the amounts recognized.
(n) Accumulated Other Comprehensive Loss
The components of accumulated other comprehensive loss, reflected in the Consolidated Statements of Equity, consists of the following (dollars in thousands):
| September 30, | |||||||||||
| 2025 | 2024 | ||||||||||
| Foreign currency translation adjustments | $ | ( | $ | ( | |||||||
| Net unrealized gains (losses) on post-retirement benefits | ( | ||||||||||
| Net unrealized gains on available-for-sale securities | |||||||||||
| Accumulated other comprehensive loss | $ | ( | $ | ( | |||||||
No income tax provisions or benefits are recorded for foreign currency translation adjustments as the undistributed earnings in our foreign subsidiaries are expected to be indefinitely reinvested.
(o) Concentration of Risk
(p) Foreign Currency Translation
(q) Stock-Based Compensation
Stock-based compensation primarily consists of restricted stock units with service or market/performance conditions. Equity awards are measured at the fair market value of the underlying stock at the grant date. We recognize
70
stock compensation expense using the straight-line attribution method over the requisite service period. We record forfeitures as they occur. For performance-based restricted stock units, the compensation cost is recognized based on the number of units expected to vest upon the achievement of the performance conditions. Shares are issued on the vesting dates net of the applicable statutory tax withholding to be paid by us on behalf of our employees. As a result, fewer shares are issued to the employee than the number of awards outstanding. We record a liability for the tax withholding to be paid by us as a reduction to Additional paid-in capital. We record any income tax effect related to stock-based awards through the Consolidated Statements of Operations. Excess tax benefits are recognized as deferred tax assets upon settlement and are subject to regular review for valuation allowance, when applicable.
(r) Leases
We have entered into a number of facility and equipment leases which qualify as operating leases under GAAP. We also have a limited number of equipment leases that qualify as financing leases. We determine if contracts with vendors represent a lease or have a lease component under GAAP at contract inception. Our leases have remaining terms ranging from less than one year six years
Operating lease right of use assets and liabilities are recognized based on the present value of the future minimum lease payments over the lease term at the lease commencement date. As our leases generally do not provide an implicit rate, we use an estimated incremental borrowing rate in determining the present value of future payments. The incremental borrowing rate represents an estimate of the interest rate we would incur at lease commencement to borrow an amount equal to the lease payments on a collateralized basis over the term of a lease within a particular location and currency environment.
Operating leases are included in Operating lease right of use assets, Short-term operating lease liabilities, and Long-term operating lease liabilities on our Consolidated Balance Sheets as of September 30, 2025 and 2024. Finance leases are included in Property and equipment, net, Accrued expenses and other current liabilities, and Other liabilities on our Consolidated Balance Sheets as of September 30, 2025 and 2024.
Lease costs for minimum lease payments is recognized on a straight-line basis over the lease term. For operating leases, costs are included within Cost of revenues, Research and development, Sales and marketing, and General and administrative lines on the Consolidated Statements of Operations. For financing leases, amortization of the finance right of use assets is included within Research and Development, Sales and marketing, and General and administrative lines on the Consolidated Statements of Operations, and interest expense is included within Interest expense.
For operating leases, the related cash payments are included in the operating cash flows on the Consolidated Statements of Cash Flows. For financing leases, the related cash payments for the principal portion of the lease liability are included in the financing cash flows on the Consolidated Statement of Cash Flows and the related cash payments for the interest portion of the lease liability are included within the operating section of the Consolidated Statement of Cash Flows.
(s) Convertible Debt
In accordance with ASU 2020-06, we record our convertible debt at face value less unamortized issuance costs. Issuance costs are amortized to Interest expense in our Consolidated Statements of Operations using the effective interest method over the contractual term of the convertible debt. We assess the short-term and long-term classification of our convertible debt on each balance sheet date. Whenever the holders have a contractual right to convert, the carrying amount of the convertible debt is reclassified to current liabilities.
Prior to the adoption of ASU 2020-06: (i) we bifurcate the debt and equity (the contingently convertible feature) components of our convertible debt instruments in a manner that reflects our nonconvertible debt borrowing rate at the time of issuance; (ii) the equity components of our convertible debt instruments were recorded within stockholders’ equity with an allocated issuance premium or discount; (iii) the debt issuance premium or discount was amortized to Interest expense in our Consolidated Statements of Operations using the effective interest method over the contractual term of the convertible debt. We assess the short-term and long-term classification of our convertible debt on each balance sheet date. Whenever the holders have a contractual right to convert, the carrying amount of the convertible debt is reclassified to current liabilities, with the corresponding equity component classified from additional paid-in capital to mezzanine equity, as needed.
71
(t) Net Loss Per Share
Basic net loss per share is computed using the weighted-average number of common shares outstanding during the period. Diluted net loss per share is computed using the weighted-average number of common shares, giving effect to potentially dilutive securities outstanding during the period. Potentially dilutive securities consist of restricted stock units, contingently issuable shares, and potential issuance of stock upon conversion of our Notes, as more fully described in Note 17. The dilutive effect of the Notes is reflected in net loss per share by application of the “if-converted” method. The “if-converted” method is only assumed in periods where such application would be dilutive. In applying the “if-converted” method for diluted net loss per share, we would assume conversion of the Notes at the respective ratio as further described in Note 17. Assumed converted shares of our common stock are weighted for the period the Notes were outstanding.
(u) Recently Adopted Accounting Standards
In November 2023, the Financial Accounting Standard Board (“FASB”) issued Accounting Standards Update (“ASU”) 2023-07, “Segment Reporting (Topic 280): Improvements to Reportable Segment Disclosures” (“ASU 2023-07”), which requires enhanced disclosures of segment information on an annual and interim basis. We adopted this standard during the fiscal year ended September 30, 2025. Refer to Note 2, (i) Segment information, for additional segment reporting information.
(v) Issued Accounting Standards Not Yet Adopted
From time to time, new accounting pronouncements are issued by the FASB and are adopted by us as of the specified effective dates. Unless otherwise discussed, such pronouncements will not have a significant impact on our consolidated financial position, results of operations or cash flows, or do not apply to our operations.
In December 2023, the FASB issued ASU No. 2023-09, “Income Taxes (Topic 740): Improvements to Income Tax Disclosures” (“ASU 2023-09”), which requires greater disaggregation of income tax disclosures related to the income tax rate reconciliation and income taxes paid and is effective for fiscal years beginning after December 15, 2024. Early adoption is permitted for annual financial statements that have not yet been issued. The amendments should be applied on a prospective basis although retrospective application is permitted. We are currently in the process of evaluating the effects of this pronouncement on our consolidated financial statements and disclosures.
In November 2024, the FASB issued ASU 2024-03, “Income Statement—Reporting Comprehensive Income—Expense Disaggregation Disclosures (Subtopic 220-40): Disaggregation of Income Statement Expenses” (“ASU 2024-03”), which requires disclosure about the types of costs and expenses included in certain expense captions presented on the income statement. ASU 2024-03 is effective for fiscal years beginning after December 15, 2026, and for interim periods within fiscal years beginning after December 15, 2027. Early adoption is permitted, and may be applied either prospectively or retrospectively. We are currently evaluating this pronouncement to determine its impact on our disclosures.
In July 2025, the FASB issued ASU 2025-05, "Financial Instruments - Credit Losses (Topic 326): Measurement of Credit Losses for Accounts Receivable and Contract Assets (ASU 2025-05)", which introduces targeted relief to reduce complexity and cost when estimating expected credit losses for current accounts receivable and current contract assets arising from revenue transactions accounted for under Topic 606. Currently, guidance requires entities to incorporate macroeconomic forecasts in determining expected credit loss estimates. The current provision provides relief for these aforementioned credit losses by utilizing a practical expedient available to all entities, allowing an entity to assume that current conditions as of the balance sheet date remain unchanged over the remaining life of an asset; assuming they develop reasonable and supportable forecasts as part of estimating expected credit losses. This removes the requirement to rely on macroeconomic forecasts. Additionally, if selected, an accounting policy election permits eligible entities to consider post-balance sheet collection activity when estimating expected credit losses. This will be effective for fiscal years starting after December 15, 2025, with early adoption permissible on a prospective basis. We are currently evaluating this pronouncement to determine its impact on our disclosures.
In September 2025, the FASB issued ASU 2025-06, "Intangibles - Goodwill and Other - Internal-Use Software (Subtopic 350-40): Targeted Improvements to the Accounting for Internal-Use Software", which removes all references to prescriptive and sequential software development stages. It will now require entities to start capitalizing software cost when management has authorized and committed to funding the software project and it is probable that the project will be completed and the software will be used to perform the function intended. The standard also specifies that the disclosures in "Subtopic 360-10, Property Plant, and Equipment" are required for all capitalized internal-use software
72
costs. This will be effective for fiscal years starting after December 15, 2027, with early adoption permissible on a prospective basis. We are currently evaluating this pronouncement to determine its impact on our disclosures.
3. Revenue Recognition
We primarily derive revenue from the following sources: (1) royalty-based software or intellectual property “IP” license arrangements, (2) connected services, and (3) professional services. Revenue is reported net of applicable sales and use tax, value-added tax and other transaction taxes imposed on the related transaction including mandatory government charges that are passed through to our customers. We account for a contract when both parties have approved and committed to the contract, the rights of the parties are identified, payment terms are identified, the contract has commercial substance and collectability of consideration is probable.
Our arrangements with customers may contain multiple products and services. We account for individual products and services separately if they are distinct—that is, if a product or service is separately identifiable from other items in the contract and if a customer can benefit from it on its own or with other resources that are readily available to the customer.
We recognize revenue after applying the following five steps for arrangements with customers within the scope of ASC 606:
•identification of the contract, or contracts, with a customer;
•identification of the performance obligations in the contract, including whether they are distinct within the context of the contract;
•determination of the transaction price, including the constraint on variable consideration;
•allocation of the transaction price to the performance obligations in the contract; and
•recognition of revenue when, or as, performance obligations are satisfied.
We allocate the transaction price of the arrangement based on the relative estimated standalone selling price ("SSP") of each distinct performance obligation. In determining SSP, we maximize observable inputs, when possible. Since prices vary from customer to customer based on customer relationship, volume discount and contract type, in instances where the SSP is not directly observable, we estimate SSP by considering a number of data points, including cost of developing and supplying each performance obligation; types of offerings; and gross margin objectives and pricing practices, such as contractually stated prices, discounts offered, and applicable price lists.
We only include estimated amounts in the transaction price to the extent it is probable that a significant reversal of cumulative revenue recognized will not occur when the uncertainty associated with the variable consideration is resolved. When allocating the transaction price under ASC 606, estimates related to variable consideration, which are typically related to usage-based volume estimates, are evaluated based on various assessments such as historical data, current market conditions and other relevant factors. Other forms of contingent revenue or variable consideration are infrequent.
Revenue is recognized when control of these product or services are transferred to our customers, in an amount that reflects the consideration we expect to be entitled to in exchange for those products or services.
We assess the timing of the transfer of products or services to the customer as compared to the timing of payments to determine whether a significant financing component exists. In accordance with the practical expedient in ASC 606-10-32-18, we do not assess the existence of a significant financing component when the difference between payment and transfer of deliverables is a year or less. If the difference in timing arises for reasons other than the provision of finance to either the customer or us, no financing component is deemed to exist. The primary purpose of our invoicing terms is to provide customers with simplified and predictable ways of purchasing our services, not to receive or provide financing from or to customers. We do not consider set-up fees nor other upfront fees paid by our customers to represent a financing component.
Reimbursements for out-of-pocket costs generally include, but are not limited to, costs related to transportation, lodging and meals. When applicable, revenue from reimbursed out-of-pocket costs is accounted for as variable consideration.
73
(a) Performance Obligations
Licenses
Embedded software and technology licenses operate without access to external networks and information. Embedded licenses sold with non-distinct professional services to customize and/or integrate the underlying software and technology are accounted for as a combined performance obligation. Revenue from the combined performance obligation is recognized over time based upon the progress towards completion of the project, which is measured based on the labor hours already incurred to date as compared to the total estimated labor hours.
Revenue from distinct embedded software and technology licenses, which do not require professional services to customize and/or integrate the software license, is recognized at the point in time when the software and technology is made available to the customer and control is transferred. For income statement presentation purposes, we separate distinct embedded license revenue from professional services revenue by allocating the transaction price based on their relative SSPs.
Revenue from embedded software and technology licenses sold on a royalty basis, where the license of non-exclusive intellectual property is the predominant item to which the royalty relates, is recognized in the period the usage occurs in accordance with ASC 606-10-55-65(A).
For royalty arrangements that include fixed consideration related to usage guarantees, the fixed consideration is recognized when the software is made available to the customer.
Connected Services
Connected services, which allow our customers to use the hosted software over the contract period without taking possession of the software, are provided on a usage basis as consumed or on a fixed fee subscription basis. Our connected services contract terms generally range from to five years .
As each day of providing services is substantially the same and the customer simultaneously receives and consumes the benefits as access is provided, we have determined that our usage basis connected services arrangements are a single performance obligation comprised of a series of distinct services. These services include variable consideration, typically a function of usage. We recognize revenue as each distinct service period is performed (i.e., recognized as incurred).
Fixed fee subscription basis revenue represents a single promise to stand-ready to provide access to our connected services. We recognize revenue over time on a ratable basis over the respective hosting subscription term.
Our connected service arrangements generally include services to develop, customize, and stand-up applications for each customer. In determining whether these services are distinct, we consider the dependence of the cloud service on the up-front development and stand-up, as well as availability of the services from other vendors. We have concluded that the up-front development, stand-up and customization services are not distinct performance obligations, and as such, revenue for these activities is recognized over the period during which the cloud-connected services are provided, and is included within Connected services revenue. There can be instances where the customer purchases a software license that allows them to take possession of the software to enable hosting by the customer or a third-party. For such arrangements, the performance obligation of the license is completed at a point in time once the customer takes possession of the software.
Professional Services
Revenue from distinct professional services, including training, is recognized over time based upon the progress towards completion of the project, which is measured based on the labor hours already incurred to date as compared to the total estimated labor hours.
(b) Significant Judgments
Determining whether products and services are considered distinct performance obligations that should be accounted for separately versus together may require significant judgment. Our license contracts often include professional services to customize and/or integrate the licenses into the customer’s environment. Judgment is required to determine whether the license is considered distinct and accounted for separately, or not distinct and accounted for together with professional services. Furthermore, hybrid contracts that contain both embedded and connected license and professional
74
services are analyzed to determine if the products and services are distinct or have stand-alone functionality to determine the revenue treatment.
We allocate the transaction price of the arrangement based on the relative estimated SSP of each distinct performance obligation. Judgment is required to determine the SSP for each distinct performance obligation. In determining SSP, we maximize observable inputs, when possible. Since our prices vary from customer to customer based on customer relationship, volume discount and contract type, there are instances where the SSP is not directly observable. In such instances, we estimate SSP by considering a number of data points, including cost of developing and supplying each performance obligation; types of offerings; and gross margin objectives and pricing practices, such as contractually stated prices, discounts offered, and applicable price lists. These factors may vary over time, depending upon the unique facts and circumstances related to each deliverable. We review the SSP for each distinct performance obligation on a periodic basis, or when the underlying factors are deemed to have changed, and make updates when appropriate.
(c) Disaggregated Revenue
Revenues, classified by the major geographic region in which our customers are located, for the fiscal years ended September 30, 2025, 2024 and 2023 (dollars in thousands):
| Year Ended September 30, | |||||||||||||||||
| 2025 | 2024 | 2023 | |||||||||||||||
| Revenues: | |||||||||||||||||
| United States | $ | $ | $ | ||||||||||||||
| Other Americas | |||||||||||||||||
| Germany | |||||||||||||||||
| Other Europe, Middle East and Africa | |||||||||||||||||
| Japan | |||||||||||||||||
| Other Asia-Pacific | |||||||||||||||||
| Total net revenues | $ | $ | $ | ||||||||||||||
Revenues relating to two customers accounted for $32.1 million, or 12.7 %, and $25.8 million, or 10.3 % of total net revenues for the fiscal year ended September 30, 2025.
Revenues relating to one customer accounted for $84.2 million, or 25.4 % of total net revenues for the fiscal year ended September 30, 2024.
Revenues relating to one customer accounted for $42.1 million, or 14.3 %, of total net revenues for the fiscal year ended September 30, 2023.
(d) Contract Acquisition Costs
Capitalized costs primarily relate to paid commissions. In accordance with the practical expedient in ASC 606-10-10-4, we apply a portfolio approach to estimate contract acquisition costs for groups of customer contracts. We elect to apply the practical expedient in ASC 340-40-25-4 and will expense contract acquisition costs as incurred where the expected period of benefit is one year or less. Contract acquisition costs are deferred and amortized on a straight-line basis over the period of benefit, which we have estimated to be, on average, between and eight years . The period of benefit was determined based on an average customer contract term, expected contract renewals, changes in technology and our ability to retain customers, including canceled contracts. We assess the amortization term for all major transactions based on specific facts and circumstances. Contract acquisition costs are classified as current or noncurrent assets based on when the expense will be recognized. The current and noncurrent portions of contract acquisition costs are included in Prepaid expenses and other current assets, and in Other assets, respectively. As of September 30, 2025 and 2024, we had $5.3 million and $7.1 million of contract acquisition costs. We had amortization expense of $2.3 million, $3.8 million and $3.8 million related to these costs during the fiscal years ended September 30, 2025, 2024 and 2023, respectively. There was no impairment related to contract acquisition costs.
(e) Capitalized Contract Costs
We capitalize incremental costs incurred to fulfill our contracts that (i) relate directly to the contract, (ii) are expected to generate resources that will be used to satisfy our performance obligation under the contract, and (iii) are
75
expected to be recovered through revenue generated under the contract. Our capitalized costs consist primarily of setup costs, such as costs to standup, customize and develop applications for each customer, which are incurred to satisfy our stand-ready obligation to provide access to our connected offerings. These contract costs are expensed to cost of revenue as we satisfy our stand-ready obligation over the contract term which we estimate to be between and eight years , on average. The contract term was determined based on an average customer contract term, expected contract renewals, changes in technology, and our ability to retain customers, including canceled contracts. We classify these costs as current or noncurrent based on the timing of when we expect to recognize the expense. The current and noncurrent portions of capitalized contract fulfillment costs are presented as Deferred costs.
We had amortization expense of $6.0 million, $8.9 million and $9.9 million related to these costs during the fiscal years ended September 30, 2025, 2024 and 2023, respectively. There was no impairment related to contract costs capitalized.
(f) Trade Accounts Receivable and Contract Balances
We classify our right to consideration in exchange for deliverables as either a receivable or a contract asset. A receivable is a right to consideration that is unconditional (i.e. only the passage of time is required before payment is due). We present such receivables in Accounts receivable, net in our Consolidated Balance Sheets at their net estimated realizable value. Accounts receivable, net as of September 30, 2025, 2024, and 2023 were $58.9 million, $62.8 million, and $61.3 million. We maintain an allowance for credit losses to provide for the estimated amount of receivables and contract assets that may not be collected.
Our contract assets and liabilities are reported in a net position on a contract-by-contract basis at the end of each reporting period.
Contract assets include unbilled amounts from long-term contracts when revenue recognized exceeds the amount billed to the customer, and right to payment is not solely subject to the passage of time. The current and noncurrent portions of contract assets are included in Prepaid expenses and other current assets and Other assets, respectively. The table below shows significant changes in contract assets (dollars in thousands):
| Contract assets | |||||
| Balance as of September 30, 2023 | $ | ||||
| Revenues recognized but not billed | |||||
| Amounts reclassified to accounts receivable, net | ( | ||||
| Write-off of contract assets | ( | ||||
| Foreign exchange impact on ending balance | |||||
| Balance as of September 30, 2024 | |||||
| Revenues recognized but not billed | |||||
| Amounts reclassified to accounts receivable, net | ( | ||||
| Foreign exchange impact on ending balance | ( | ||||
| Balance as of September 30, 2025 | $ | ||||
During the fiscal year ended September 30, 2024, we recorded a $6.1 million provision relating to the bankruptcy of one fitness equipment manufacturer, of which $6.0 million relates to a contract asset and $0.1 million relates to a trade receivable.
Our contract liabilities, which we present as deferred revenue, consist of advance payments and billings in excess of revenues recognized. We classify deferred revenue as current or noncurrent based on when we expect to recognize the revenues. The table below shows significant changes in deferred revenue (dollars in thousands):
76
| Deferred revenue | |||||
| Balance as of September 30, 2023 | $ | ||||
| Amounts billed but not recognized | |||||
| Revenue recognized | ( | ||||
| Foreign exchange impact on ending balance | |||||
| Balance as of September 30, 2024 | |||||
| Amounts billed but not recognized | |||||
| Revenue recognized | ( | ||||
| Foreign exchange impact on ending balance | |||||
| Balance as of September 30, 2025 | $ | ||||
(g) Remaining Performance Obligations
The following table includes estimated revenue expected to be recognized in the future related to performance obligations that are unsatisfied or partially unsatisfied at September 30, 2025 (dollars in thousands):
Within Year | Two to Five years | Greater than Five Years | Total | ||||||||||||||||||||
| Total revenue | $ | $ | $ | $ | |||||||||||||||||||
The table above includes fixed remaining performance obligations and does not include contingent usage-based activities, such as royalties and usage-based connected services. On October 31, 2023, we entered into an early termination agreement relating to a legacy contract acquired by Nuance through a 2013 acquisition. Previously the term of the contract ended on December 31, 2025, whereas the agreement signed on October 31, 2023, updated the termination date to December 31, 2023. There was no cash flow associated with this legacy contract. The effect of this change was to accelerate $67.8 million of deferred revenue into fiscal year 2024. We provided services to a separate customer, who in turn provided services to our legacy customer. Our customer terminated services on October 31, 2023. There was no cash flow associated with this contract. The effect of this termination was to accelerate $9.9 million of deferred revenue into fiscal year 2024.
4. Earnings Per Share
Basic earnings per share is computed by dividing net loss by the weighted-average number of shares of common stock outstanding during the period. Diluted earnings per share is computed by dividing net loss by the weighted-average number of shares of common stock outstanding during the period, increased to include the number of shares of common stock that would have been outstanding had potential dilutive shares of common stock been issued. The dilutive effect of restricted stock units is reflected in diluted net loss per share by applying the treasury stock method.
The dilutive effect of the Notes (as defined in Note 17) is reflected in net loss per share by application of the “if-converted” method. The “if-converted” method is only assumed in periods where such application would be dilutive. In applying the “if-converted” method for diluted net loss per share, we would assume conversion of the Notes at the respective conversion ratio as further described in Note 17. Assumed converted shares of our common stock are weighted for the period the Notes were outstanding.
77
The following table presents the reconciliation of the numerator and denominator for calculating net loss per share:
| September 30, | |||||||||||||||||
| in thousands, except per share data | 2025 | 2024 | 2023 | ||||||||||||||
| Numerator: | |||||||||||||||||
| Net loss | $ | ( | $ | ( | $ | ( | |||||||||||
| Denominator: | |||||||||||||||||
| Weighted average common shares outstanding - basic and diluted | |||||||||||||||||
| Net loss per common share: | |||||||||||||||||
| Basic | $ | ( | $ | ( | $ | ( | |||||||||||
| Diluted | $ | ( | $ | ( | $ | ( | |||||||||||
We exclude weighted-average potentially issuable shares from the calculations of diluted net loss per share during the applicable periods because their inclusion would have been anti-dilutive. The following table sets forth potential shares that were considered anti-dilutive for the fiscal years ended September 30, 2025, 2024 and 2023:
| Year Ended September 30, | |||||||||||||||||
| in thousands | 2025 | 2024 | 2023 | ||||||||||||||
| Restricted stock awards | |||||||||||||||||
| Contingently issuable stock awards | |||||||||||||||||
| Conversion option of our Notes | |||||||||||||||||
5. Fair Value Measurements
Fair value is defined as the price that would be received to sell an asset or paid to transfer a liability in an orderly transaction between market participants at the measurement date. Valuation techniques must maximize the use of observable inputs and minimize the use of unobservable inputs. When determining fair value measurements for assets and liabilities recorded at fair value, we consider the principal or most advantageous market in which we would transact and consider assumptions that market participants would use in pricing the asset or liability.
The classification of a financial asset or liability within the hierarchy is based upon the lowest level input that is significant to the fair value measurement as of the measurement date as follows:
•Level 1 - Inputs are unadjusted quoted prices in active markets for identical assets or liabilities.
•Level 2 - Inputs are quoted prices for similar assets and liabilities in active markets or inputs that are observable for the asset or liability, either directly or indirectly through market corroboration, for substantially the full term of the assets or liabilities.
•Level 3 - Unobservable inputs that are supported by little or no market activity.
The following table presents information about our financial assets that are measured at fair value and indicates the fair value hierarchy of the valuation inputs used (dollars in thousands) as of:
78
| September 30, 2025 | |||||||||||||||||
| Fair Value | Cash and Cash Equivalents | Marketable Securities | |||||||||||||||
| Level 1: | |||||||||||||||||
Money market funds $ | $ | $ | $ | ||||||||||||||
Level I Government Securities $ | $ | ||||||||||||||||
Corporate bonds, $ | |||||||||||||||||
| Level 2: | |||||||||||||||||
Level II Government securities $ | |||||||||||||||||
Time deposits, $ | |||||||||||||||||
Convertible debt, $ | |||||||||||||||||
| Total assets | $ | $ | $ | ||||||||||||||
| September 30, 2024 | |||||||||||||||||
| Fair Value | Cash and Cash Equivalents | Marketable Securities | |||||||||||||||
| Level 1: | |||||||||||||||||
Money market funds $ | $ | $ | $ | ||||||||||||||
| Level 2: | |||||||||||||||||
Government securities $ | |||||||||||||||||
Time deposits, $ | |||||||||||||||||
Corporate bonds, $ | |||||||||||||||||
Convertible debt, $ | |||||||||||||||||
| Total assets | $ | $ | $ | ||||||||||||||
(a)Money market funds and other highly liquid investments with original maturities of 90 days or less are included within Cash and cash equivalents in the Consolidated Balance Sheets.
(b)Government securities, commercial paper and corporate bonds with original maturities greater than 90 days are included within Marketable securities in the Consolidated Balance Sheets and classified as current or noncurrent based upon whether the maturity of the financial asset is less than or greater than 12 months.
(c)Debt securities are classified as current or long-term within the Consolidated Balance Sheet based upon whether the maturity of the financial asset is less than or greater than 12 months.
During the fiscal years ended September 30, 2025, 2024, and 2023, we recorded unrealized gains related to our marketable securities of less than $0.1 million, $0.3 million, and $0.2 million, respectively, within Accumulated other comprehensive loss. During the year ended September 30, 2025, in the course of our periodic review of our investments, we observed a deterioration in the market conditions with respect to a single investment in convertible notes. Accordingly, we performed a fair value assessment of our investment in the convertible notes, resulting in a write down of $2.4 million, recognized in other (expense) income, net.
The carrying amounts of certain financial instruments, including cash held in banks, accounts receivable, and accounts payable, approximate fair value due to their short-term maturities and are excluded from the fair value tables above.
Derivative financial instruments are recognized at fair value using quoted forward rates and prices and classified within Level 2 of the fair value hierarchy. See Note 6 – Derivative Financial Instruments for additional details.
Long-term debt
The estimated fair value of our Long-term debt is determined by Level 1 inputs and is based on observable market data including prices for similar instruments. As of September 30, 2025 and 2024, the estimated fair value of our Notes was $174.2 million and $184.8 million, respectively. The Notes are recorded at face value less unamortized debt discount and transaction costs on our Consolidated Balance Sheets. The carrying amount of the Senior Credit Facilities (as defined in Note 17) approximates fair value given the underlying interest rate applied to such amounts outstanding is currently set to the prevailing market rate.
79
Assets and Liabilities Measured at Fair Value on a Non-recurring Basis
We measure certain assets at fair value on a non-recurring basis, primarily goodwill, intangible assets, and long-lived assets. These assets were initially measured and recognized at amounts equal to the fair value determined as of the date of acquisition or purchase and are subject to changes in value only for foreign currency translation and impairment. See Note 2 - Summary of Significant Accounting Policies for additional information on impairment assessments and related Level 3 inputs for goodwill, indefinite-lived intangible assets and long-lived assets.
Equity securities
We have a non-controlling equity investment in a privately held company. We evaluated the equity investment under the voting model and concluded consolidation was not applicable. We accounted for the investment by electing the measurement alternative for investments without readily determinable fair values. The non-marketable equity investment is carried at cost less any impairment, plus or minus adjustments resulting from observable price changes in orderly transactions for the identical or a similar investment of the same issuer, which is recorded within the Consolidated Statements of Operations.
Investments without readily determinable fair values were $2.6 million and $2.6 million as of September 30, 2025 and 2024, respectively. These investments are included within Other assets on the Consolidated Balance Sheets. Impairment related to investments without readily determinable fair values was $0.5 million during the fiscal year ended September 30, 2023. No
6. Derivative Financial Instruments
We operate internationally and, in the normal course of business, are exposed to fluctuations in foreign currency exchange rates related to third-party vendor and intercompany payments for goods and services within our non-U.S. subsidiaries. We use foreign exchange forward contracts that are not designated as hedges to manage currency risk. The contracts can have maturities up to three years . As of September 30, 2025 and 2024, the total notional amount of forward contracts was $16.7 million and $59.1 million, respectively. As of September 30, 2025 and 2024, the weighted-average remaining maturity of these instruments was approximately 6.0 and 9.9 months, respectively.
The following table summarizes the fair value and presentation in the Consolidated Balance Sheets for derivative instruments as of September 30, 2025 and 2024 (dollars in thousands):
| Fair Value | ||||||||||||||||||||
| Derivatives not designated as hedges | Classification | September 30, 2025 | September 30, 2024 | |||||||||||||||||
| Foreign currency forward contracts | Prepaid expenses and other current assets | $ | $ | |||||||||||||||||
| Foreign currency forward contracts | Other assets | |||||||||||||||||||
| Foreign currency forward contracts | Accrued expenses and other current liabilities | |||||||||||||||||||
| Foreign currency forward contracts | Other liabilities | |||||||||||||||||||
The following tables display a summary of the loss related to foreign currency forward contracts within the Consolidated Statements of Operations for the fiscal years ended September 30, 2025, 2024 and 2023 (dollars in thousand):
| Loss recognized in earnings | ||||||||||||||||||||||||||
| Year Ended September 30, | ||||||||||||||||||||||||||
| Derivatives not designated as hedges | Classification | 2025 | 2024 | 2023 | ||||||||||||||||||||||
| Foreign currency forward contracts | $ | ( | $ | ( | $ | ( | ||||||||||||||||||||
7. Goodwill and Intangible Assets
(a) Goodwill
For the fiscal year ended September 30, 2025, we recorded a non-cash out-of-period adjustment resulting in an increase of $3.8 million to deferred tax assets to correct an error related to a prior period, with an offset to goodwill shown as an adjustment. See Note 16 – Income Taxes for additional details.
The changes in the carrying amount of goodwill for the fiscal years ended September 30, 2025 and 2024 were as follows (dollars in thousands):
80
| Total | |||||
| Balance as of September 30, 2023 | $ | ||||
| Goodwill impairment | ( | ||||
| Effect of foreign currency translation | |||||
| Balance as of September 30, 2024 | |||||
| Effect of foreign currency translation | |||||
| Goodwill adjustment | ( | ||||
| Balance as of September 30, 2025 | $ | ||||
(b) Intangible Assets, Net
The following tables summarizes the gross carrying amounts and accumulated amortization of intangible assets by major class (dollars in thousands):
| September 30, 2025 | |||||||||||||||||||||||
| Gross Carrying Amount | Accumulated Amortization | Net Carrying Amount | Weighted Average Remaining Life (Years) | ||||||||||||||||||||
| Customer relationships | $ | $ | ( | $ | |||||||||||||||||||
| Technology and patents | ( | ||||||||||||||||||||||
| Total | $ | $ | ( | $ | |||||||||||||||||||
| September 30, 2024 | |||||||||||||||||||||||
| Gross Carrying Amount | Accumulated Amortization | Net Carrying Amount | Weighted Average Remaining Life (Years) | ||||||||||||||||||||
| Customer relationships | $ | $ | ( | $ | |||||||||||||||||||
| Technology and patents | ( | ||||||||||||||||||||||
| Total | $ | $ | ( | $ | |||||||||||||||||||
Amortization expense related to intangible assets in the aggregate amounted to $1.7 million, $2.3 million, and $6.3 million for the fiscal years ended September 30, 2025, 2024, and 2023, respectively, in the accompanying Consolidated Statements of Operations. As of September 30, 2025, our intangible assets were fully amortized.
8. Property and Equipment, Net
Property and equipment, net consisted of the following (dollars in thousands):
| Useful Life | September 30, | ||||||||||||||||
| (In years) | 2025 | 2024 | |||||||||||||||
| Machinery and equipment | $ | $ | |||||||||||||||
| Computers, software and equipment | |||||||||||||||||
| Leasehold improvements | |||||||||||||||||
| Furniture and fixtures | |||||||||||||||||
| Finance leases | |||||||||||||||||
| Construction in progress | |||||||||||||||||
| Subtotal | |||||||||||||||||
| Less: accumulated depreciation | ( | ( | |||||||||||||||
| Total | $ | $ | |||||||||||||||
As of September 30, 2025 and 2024, the net book value of capitalized internal-use software costs was $14.7 million and $16.9 million, respectively, which are included within computers, software, and equipment. Depreciation expense for the fiscal years ended September 30, 2025, 2024, and 2023 was $8.9 million, $8.3 million, and $9.8 million,
81
respectively, which included amortization expense of $3.0 million, $2.7 million, and $4.0 million, respectively, for internally developed software costs.
The following table presents our property and equipment, net by geography at September 30, 2025 and 2024 (dollars in thousands):
| September 30, | |||||||||||
| 2025 | 2024 | ||||||||||
| Long-lived assets: | |||||||||||
| United States | $ | $ | |||||||||
| Germany | |||||||||||
| Canada | |||||||||||
| Other countries | |||||||||||
| Total long-lived assets | $ | $ | |||||||||
9. Accrued Expenses and Other Current Liabilities
Accrued expenses and other current liabilities consisted of the following (dollars in thousands):
| September 30, | |||||||||||
| 2025 | 2024 | ||||||||||
| Compensation | $ | $ | |||||||||
| Legal settlement | $ | $ | |||||||||
| Professional fees | |||||||||||
| Cost of revenue related liabilities | |||||||||||
| Interest payable | |||||||||||
| Sales and other taxes payable | |||||||||||
| Other | |||||||||||
| Total | $ | $ | |||||||||
The $30.0 million legal settlement for the fiscal year ended September 30, 2024 relates to the settlement of the Securities Action (as defined in Note 13). The entire settlement amount was funded by insurance proceeds for which a receivable was recorded within Prepaid and other current assets. See Note 13 - Commitment and Contingencies for additional details.
10. Restructuring and Other Costs, Net
Restructuring and other costs, net include restructuring expenses as well as other charges that are unusual in nature, are the result of unplanned events, and arise outside of the ordinary course of our business.
The following table sets forth the fiscal year ended September 30, activity relating to restructuring charges (dollars in thousands):
82
| Personnel | Facilities | Restructuring Subtotal | Other | Total | |||||||||||||||||||||||||
| Balance at September 30, 2022 | $ | $ | $ | $ | $ | ||||||||||||||||||||||||
| Restructuring and other costs, net | |||||||||||||||||||||||||||||
| Non-cash adjustment | ( | ( | |||||||||||||||||||||||||||
| Cash payments | ( | ( | ( | ( | ( | ||||||||||||||||||||||||
| Foreign exchange impact on ending balance | ( | ||||||||||||||||||||||||||||
| Balance at September 30, 2023 | |||||||||||||||||||||||||||||
| Restructuring and other costs, net | |||||||||||||||||||||||||||||
| Non-cash adjustment | ( | ( | ( | ( | |||||||||||||||||||||||||
| Cash payments | ( | ( | ( | ( | ( | ||||||||||||||||||||||||
| Foreign exchange impact on ending balance | ( | ||||||||||||||||||||||||||||
| Balance at September 30, 2024 | |||||||||||||||||||||||||||||
| Restructuring and other costs, net | |||||||||||||||||||||||||||||
| Non-cash adjustment | ( | ( | ( | ||||||||||||||||||||||||||
| Cash payments | ( | ( | ( | ( | |||||||||||||||||||||||||
| Foreign exchange impact on ending balance | ( | ||||||||||||||||||||||||||||
| Balance at September 30, 2025 | $ | $ | $ | $ | $ | ||||||||||||||||||||||||
Fiscal Year 2025
For the fiscal year ended September 30, 2025, we recorded restructuring and other costs, net of $15.4 million, which included a $12.1 million severance charge related to the elimination of personnel, of which $3.0 million related to the stock-based compensation expense for the termination of former senior management employees, and a $3.3 million charge relating to our transformation initiatives. We are focused on pursuing actions intended to position the Company to deliver on our generative AI and large language model product roadmap and also deliver improved financial results which include process optimization efforts and cost reductions.
On September 5, 2025, we announced the 2025 Plan. We currently estimate cash charges of approximately $7.4 million to $7.6 million, primarily in severance and related costs, with the majority expected to be incurred in the first quarter of fiscal 2026. Due to ongoing negotiations with labor unions and other applicable laws and regulations as of September 30, 2025, we did not meet the recognition criteria required to record a liability for estimated severance benefits, such as communication of definitive severance terms to affected employees, or that negotiations may result in significant changes to the 2025 Plan as communicated. During fiscal year 2025, we incurred an immaterial amount of professional fees directly associated with the execution of the plan, including works‑council consultations, which are recognized as incurred and presented within “Restructuring and other costs, net.” Actual amounts may differ materially due to required works‑council consultations and other legal requirements.
Fiscal Year 2024
For the fiscal year ended September 30, 2024, we recorded restructuring and other costs, net of $17.1 million, which included a $13.4 million severance charge related to the elimination of personnel, of which $8.1 million related to the 2024 Plan, $2.8 million of consulting costs relating to our transformation initiatives, and $0.8 million of other one-time charges.
Fiscal Year 2023
For the fiscal year ended September 30, 2023, we recorded restructuring and other costs, net of $11.9 million, which included a $7.8 million severance charge related to the elimination of personnel, $3.8 million of third-party fees relating to the modification of the 2025 Notes, and a $0.5 million charge resulting from the closure of facilities that will no longer be utilized.
83
11. Leases
We have entered into a number of facility and equipment leases which qualify as operating leases under GAAP. We also have a limited number of equipment leases that qualify as finance leases. We determine if contracts with vendors represent a lease or have a lease component under GAAP at contract inception. Our leases have remaining terms ranging from less than one year six years
Operating lease right of use assets and liabilities are recognized based on the present value of the future minimum lease payments over the lease term at the lease commencement date. As our leases generally do not provide an implicit rate, we use an estimated incremental borrowing rate in determining the present value of future payments. The incremental borrowing rate represents an estimate of the interest rate we would incur at lease commencement to borrow an amount equal to the lease payments on a collateralized basis over the term of a lease within a particular location and currency environment.
The following table presents certain information related to lease term and incremental borrowing rates for leases as of September 30, 2025 and 2024:
| September 30, 2025 | September 30, 2024 | ||||||||||
| Weighted-average remaining lease term (in months): | |||||||||||
| Operating leases | 46.9 | 46.0 | |||||||||
| Finance leases | 3.4 | 13.4 | |||||||||
| Weighted-average discount rate: | |||||||||||
| Operating leases | % | % | |||||||||
| Finance leases | % | % | |||||||||
The following table presents the lease-related assets and liabilities reported in the Consolidated Balance Sheets as of September 30, 2025 and 2024 (dollars in thousands):
| Classification | September 30, 2025 | September 30, 2024 | ||||||||||||||||||
| Assets | ||||||||||||||||||||
| Operating lease assets | Operating lease right of use assets | $ | $ | |||||||||||||||||
| Finance lease assets | ||||||||||||||||||||
| Total lease assets | $ | $ | ||||||||||||||||||
| Liabilities | ||||||||||||||||||||
| Current | ||||||||||||||||||||
| Operating | Short-term operating lease liabilities | $ | $ | |||||||||||||||||
| Finance | ||||||||||||||||||||
| Noncurrent | ||||||||||||||||||||
| Operating | Long-term operating lease liabilities | $ | $ | |||||||||||||||||
| Finance | ||||||||||||||||||||
| Total lease liability | $ | $ | ||||||||||||||||||
The following table presents lease expense for the fiscal years ended September 30, 2025, 2024 and 2023 (dollars in thousands):
84
| Year Ended September 30, | |||||||||||||||||
| 2025 | 2024 | 2023 | |||||||||||||||
| Finance lease costs: | |||||||||||||||||
| Amortization of right of use asset | $ | $ | $ | ||||||||||||||
| Interest on lease liability | |||||||||||||||||
| Operating lease cost | |||||||||||||||||
| Variable lease cost | |||||||||||||||||
| Sublease income | ( | ( | ( | ||||||||||||||
| Total lease cost | $ | $ | $ | ||||||||||||||
For the fiscal years ended September 30, 2025, 2024 and 2023 cash payments related to operating leases were $6.7 million, $6.6 million and $6.6 million, respectively. For the fiscal years ended September 30, 2025, 2024 and 2023, cash payments related to financing leases were $0.4 million, $0.4 million and $0.4 million, respectively, of which an immaterial amount related to the interest portion of the lease liability. For the fiscal years ended September 30, 2025, 2024 and 2023 right of use assets obtained in exchange for lease obligations were $5.9 million, $5.8 million and $2.9 million, respectively.
The table below reconciles the undiscounted future minimum lease payments under non-cancelable leases to the total lease liabilities recognized on the Consolidated Balance Sheet as of September 30, 2025 (dollars in thousands):
| Year Ending September 30, | Operating Leases | Financing Leases | Total | |||||||||||||||||
| 2026 | ||||||||||||||||||||
| 2027 | ||||||||||||||||||||
| 2028 | ||||||||||||||||||||
| 2029 | ||||||||||||||||||||
| 2030 | ||||||||||||||||||||
| Thereafter | ||||||||||||||||||||
| Total future minimum lease payments | $ | $ | $ | |||||||||||||||||
| Less effects of discounting | ( | ( | ||||||||||||||||||
| Total lease liabilities | $ | $ | $ | |||||||||||||||||
| Reported as of September 30, 2025 | ||||||||||||||||||||
| Short-term lease liabilities | $ | $ | $ | |||||||||||||||||
| Long-term lease liabilities | ||||||||||||||||||||
| Total lease liabilities | $ | $ | $ | |||||||||||||||||
12. Stockholders’ Equity
Share-based Compensation Plans
Per the Amended and Restated Certificate of Incorporation, which was adopted on October 1, 2019, 600,000,000 shares of capital stock have been authorized, consisting of 40,000,000 shares of Preferred Stock, par value $0.01 per share, or (“Preferred Stock”), and 560,000,000 shares of Common Stock, par value $0.01 per share (“Common Stock”).
On October 2, 2019, we registered the issuance of 6,350,000 shares of Common Stock, consisting of 5,300,000 shares of Common Stock reserved under the Cerence 2019 Equity Incentive Plan, (“Equity Incentive Plan”), and 1,050,000 shares of Common Stock that are reserved for issuance under the Cerence 2019 Employee Stock Purchase Plan (“ESPP”). The Equity Incentive Plan provides for the grant of incentive stock options, stock awards, stock units, stock appreciation rights, and certain other stock-based awards. The shares available for issuance will automatically increase on January 1st of each year, by the lesser of (A) three percent (3 %) of the number of shares of Common Stock outstanding as of the close of business on the immediately preceding December 31st; and (B) the number of shares of Common Stock determined by the Board on or prior to such date for such year. Awards issued under the Equity Incentive Plan may not have a term greater than ten years from the date of grant. On March 4, 2024, we registered the issuance of 600,000 shares of Common Stock, reserved for issuance under the Cerence Inc. 2024 Inducement Plan. On October 6, 2024, we adopted Amendment No. 1 to the Cerence Inc. 2024 Inducement Plan, which increased the number of authorized shares of our
85
Common Stock available for issuance under the 2024 Inducement Plan from 600,000 to 3,000,000 . On November 29, 2024, we adopted Amendment No. 2 to the Inducement Plan, which increased the number of authorized shares of our common stock available for issuance under the Inducement Plan from 3,000,000 to 4,500,000 .
Restricted Awards
The fair value of Restricted Awards, including Restricted Stock Units and Restricted Stock, is measured based upon the market price of the underlying common stock as of the date of grant. Restricted Awards generally vest over a period of three years . We also include certain Restricted Awards with vesting solely dependent on the achievement of specified performance targets. The fair value of Restricted Awards is amortized to expense over the awards applicable requisite service period. In the event that the employees’ employment with us terminates, or in the case of awards with only performance targets, if those targets are not met, any unvested shares are forfeited.
In fiscal years ended September 30, 2025, 2024 and 2023, we withheld payroll taxes totaling $2.4 million, $9.9 million and $4.9 million, respectively, related to the vesting of Restricted Awards.
Restricted Units are not included in issued and outstanding common stock until the shares are vested and released. The table below summarizes activity related to Restricted Stock Units:
| Non-Vested Restricted Stock Units | |||||||||||||||||||||||||||||||||||
| Time-Based Shares | Performance- Based Shares | Total Shares | Weighted- Average Grant-Date Fair Value | Weighted- Average Remaining Contractual Term (years) | Aggregate Intrinsic Value (in thousands) | ||||||||||||||||||||||||||||||
| Non-vested at September 30, 2024 | $ | ||||||||||||||||||||||||||||||||||
| Granted | $ | ||||||||||||||||||||||||||||||||||
| Vested | ( | ( | ( | $ | |||||||||||||||||||||||||||||||
| Forfeited | ( | ( | ( | $ | |||||||||||||||||||||||||||||||
| Non-vested at September 30, 2025 | $ | ||||||||||||||||||||||||||||||||||
| Expected to vest | $ | $ | |||||||||||||||||||||||||||||||||
Employee Stock Purchase Plan
On October 2, 2019, we adopted the ESPP and approved 1,050,000 shares for issuance under this plan. The ESPP is administered by our Board of Directors’ Compensation Committee.
The ESPP provides for the issuance of shares of our common stock to participating employees. At the end of each designated offering period, which occurs every six months on February 15 and August 15, employees can elect to purchase shares of our common stock with contributions of up to 12 % of their base pay, accumulated via payroll deductions, at an amount equal to 85 % of the lower of our stock price on (i) the first day of the offering period, or (ii) the last day of the offering period.
We use the Black-Scholes option pricing model to calculate the fair value of shares issued under the ESPP. The Black-Scholes model relies on a number of key assumptions to calculate estimated fair values. Expected volatility is based on the historical volatility of our common stock, and the expected term represents the period of time the ESPP purchase rights are expected to be outstanding and approximates the offering period. The risk-free interest rate is based on yields on U.S. Treasury Securities with a maturity similar to the estimated expected term of the ESPP purchase rights. We assume no expected dividends.
The following table sets forth the weighted-average key assumptions and fair value results for shares issued under the ESPP during the fiscal years ended September 30, 2025, 2024 and 2023:
86
| Year Ended September 30, | |||||||||||||||||
| 2025 | 2024 | 2023 | |||||||||||||||
| Expected dividend yield | % | % | % | ||||||||||||||
| Risk-free interest rate | % | % | % | ||||||||||||||
| Expected volatility | % | % | % | ||||||||||||||
| Expected life (in years) | |||||||||||||||||
| Weighted-average fair value of shares issued (per share) | $ | $ | $ | ||||||||||||||
The following table sets forth the quantities and average prices of shares issued under the ESPP for the fiscal years ended September 30, 2025, 2024 and 2023:
| Year Ended September 30, | ||||||||||||||||||||
| 2025 | 2024 | 2023 | ||||||||||||||||||
| Shares issued under the ESPP | ||||||||||||||||||||
| Average price of shares issued | $ | $ | $ | |||||||||||||||||
Stock-based Compensation
During the fiscal years ended September 30, 2025, 2024 and 2023, we recognize stock-based compensation expenses over the requisite service periods. Our share-based awards are classified within equity. Stock-based compensation for the anticipated Restricted Awards has been adjusted to reflect our estimated achievement under the modified targets and is recorded prospectively over the requisite service period.
The amounts included in the Consolidated Statements of Operations related to stock-based compensation are as follows (dollars in thousands):
| Year Ended September 30, | |||||||||||||||||
| 2025 | 2024 | 2023 | |||||||||||||||
| Cost of connected services | $ | $ | $ | ||||||||||||||
| Cost of professional services | |||||||||||||||||
| Research and development | |||||||||||||||||
| Sales and marketing | |||||||||||||||||
| General and administrative | |||||||||||||||||
| Restructuring and other costs, net | |||||||||||||||||
| Total | $ | $ | $ | ||||||||||||||
During the fiscal year ended September 30, 2025, we recorded $2.6 million in stock-based compensation due to the termination of employment of our former CEO and the resulting vesting of certain stock-based awards in Restructuring and other costs, net. During the fiscal year ended September 30, 2025, we recorded $0.4 million in stock-based compensation due to the termination of employment of a former senior management employee and the resulting vesting of certain stock-based awards in Restructuring and other costs, net.
13. Commitments and Contingencies
Litigation and Other Claims
Similar to many companies in the software industry, we are involved in a variety of claims, demands, suits, investigations and proceedings that arise from time to time relating to matters incidental to the ordinary course of our business, including at times actions with respect to contracts, intellectual property, employment, benefits and securities matters. At each balance sheet date, we evaluate contingent liabilities associated with these matters in accordance with ASC 450 “Contingencies.” If the potential loss from any claim or legal proceeding is considered probable and the amount can be reasonably estimated, we accrue a liability for the estimated loss. Significant judgments are required for the determination of probability and the range of the outcomes, and estimates are based only on the best information available at the time. Due to the inherent uncertainties involved in claims and legal proceedings and in estimating losses that may arise, actual outcomes may differ from our estimates. Contingencies deemed not probable or for which losses were not
87
estimable in one period may become probable, or losses may become estimable in later periods, which may have a material impact on our results of operations and financial position. As of September 30, 2025, accrued losses were not material to our consolidated financial statements, and we do not expect any pending matter to have a material impact on our consolidated financial statements.
City of Miami Fire Fighters’ and Police Officers’ Retirement Trust Action
On February 25, 2022, a purported shareholder class action captioned as City Of Miami Fire Fighters’ and Police Officers’ Retirement Trust v. Cerence Inc., et al. (the “Securities Action”) was filed in the United States District Court for the District of Massachusetts, naming the Company and two of its former officers as defendants. Following the court’s selection of a lead plaintiff and lead counsel, an amended complaint was filed on July 26, 2022 alleging classwide claims of material misrepresentations and/or omissions of material fact in the Company’s public disclosures during the period from November 16, 2020 to February 4, 2022, in violation of Sections 10(b) and 20(a) of the Securities Exchange Act of 1934, as amended, and Rule 10b-5 promulgated thereunder. On December 18, 2024, the Court granted final approval of a settlement of the claims in the Securities Action for $30.0 million, which was paid for by insurance proceeds.
Derivative Actions
On May 10 and 12, 2022, respectively, plaintiffs William Shafer and Peter Morse filed shareholder derivative complaints in the United States District Court for the District of Massachusetts on behalf of Cerence Inc. against defendants (and former officers) Sanjay Dhawan and Mark J. Gallenberger as well as board members Arun Sarin, Thomas Beaudoin, Marianne Budnik, Sanjay Jha, Kristi Ann Matus, Alfred Nietzel and then-current CEO and board member Stefan Ortmanns. These actions are premised on factual contentions substantially similar to those made in the Securities Action and contain substantially similar legal contentions. As such, on June 13, 2022, at the parties’ request, the court consolidated these derivative actions into a single action and appointed co-lead counsel for plaintiffs in that consolidated action. On February 3, 2025, defendants filed a motion to dismiss on the grounds of demand futility and failure to state a claim. On June 18, 2025, the Court granted the motion without leave to amend.
Three shareholder derivative complaints making factual and legal contentions substantially similar to those raised in the consolidated federal derivative action were also filed in the Delaware Court of Chancery: the first filed on October 19, 2022 by plaintiff Melinda Hipp against the defendants named in the consolidated federal derivative action and board member Douglas Davis, the second filed on August 17, 2023 by plaintiff Catherine Fleming against the defendants named in the consolidated federal derivative action, and the third filed on July 10, 2024 by plaintiff Alberto Goncalves against the defendants named in the consolidated federal derivative action. On October 20, 2023, Ms. Hipp voluntarily dismissed her action with prejudice. On July 22, 2025, Mr. Goncalves's action was dismissed without prejudice at his request. On July 31, 2025, Ms. Fleming's action was dismissed without prejudice by stipulation of the parties.
A.P., a minor, by and through her guardian, Carlos Pena and Carlos Pena Action
On March 24, 2023, plaintiffs A.P., a minor, by and through her guardian, Carlos Pena, and Carlos Pena, each individually and on behalf of similarly situated individuals filed a purported class action lawsuit in the Circuit Court of Cook County, Illinois, Chancery Division (Case. No. 2023CH02866 (Cir. Ct. Cook Cnty. 2023)). The case was removed to Federal Court (Case No. 1:23CV2667 (N.D. Ill.)), and then severed and remanded back in part, so there are two pending cases. Plaintiffs subsequently amended the federal complaint twice, with the latest second amended complaint, filed on July 13, 2023, adding plaintiffs Randolph Freshour and Vincenzo Allan, each also filing individually and on behalf of similarly situated individuals. Plaintiffs allege that Cerence violated the Illinois Biometric Information Privacy Act (“BIPA”), 740 ILCS 14/1 et seq. through Cerence’s Drive Platform technology, which is integrated in various automobiles. The named plaintiffs allegedly drove or rode in a vehicle with Cerence’s Drive Platform technology. Across both cases, plaintiffs allege that Cerence violated: (1) BIPA Section 15(a) by possessing biometrics without any public written policy for their retention or destruction; (2) BIPA Section 15(b) by collecting, capturing, or obtaining biometrics without written notice or consent; (3) BIPA Section 15(c) by profiting from biometrics obtained from Plaintiffs and putative class members; and (4) BIPA Section 15(d) by disclosing biometrics to third party companies without consent. Cerence filed motions to dismiss both cases. On February 27, 2024, the Circuit Court issued an order denying Cerence's motion to dismiss. On April 16, 2024, Cerence filed its answer and affirmative defenses, a motion to certify the Court’s order on Cerence’s motion to dismiss, and a motion to stay. Thereafter, in exchange for Cerence withdrawing its motions to certify and stay, plaintiffs filed amended complaints in both the Circuit Court and Federal Court, which 1) dismissed some plaintiffs and 2) amended the class definition to include Illinois individuals who owned, leased, and/or created user profiles for vehicles with Cerence's "voice recognition technology" (rather than anyone in Illinois whose "voiceprint" was collected or stored by Cerence). Cerence filed its answers in both and the parties concluded fact discovery. The parties are now briefing class certification, which briefing is scheduled to be complete on December 15, 2025. On November 3, 2025, plaintiffs moved to stay the Federal Court case pending the Circuit Court's ruling on class certification. Plaintiffs are seeking statutory
88
damages of $5,000 for each willful and/or reckless violation of BIPA and, alternatively, damages of $1,000 for each negligent violation of BIPA. Given the uncertainty of litigation, the preliminary stage of the case, and the legal standards that must be met for, among other things, class certification and success on the merits, we cannot estimate the reasonably possible loss or range of loss that may result from this action.
Samsung Electronics Co. Ltd and Samsung Electronics America, Inc.
On October 13, 2023, Cerence filed its first patent infringement complaint against Samsung alleging infringement of five Cerence patents (hereinafter referred to as “Samsung I”). On March 15, 2024, Cerence filed its second patent infringement complaint against Samsung alleging infringement of four additional Cerence patents (hereinafter referred to as “Samsung II”). In its responsive pleading to Samsung II, on July 10, 2024, Samsung asserted counterclaims, alleging infringement of U.S. Patent Nos. 10,395,657; 10,720,162; 11,823,682; and 9,583,103 against the Cerence Assistant. Samsung sought damages, including trebled damages, and its costs and fees. On September 4, 2024, Cerence filed its answer denying the allegations and counterclaims of invalidity and noninfringement. Trial for Samsung I was scheduled to begin in October 2025 and trial for Samsung II was scheduled to begin in April 2026. On October 28, 2025 Samsung and Cerence resolved these disputes by entering into a cross-license agreement, which, among other things, resulted in Samsung agreeing to pay Cerence a one-time lump sum payment in the total amount of $49.5 million, due within 30 days. The cross-license agreement requires that each party is responsible for bearing their own costs for any associated legal fees incurred as a result of the alleged complaints and negotiations resulting in the dispute resolution. As a result, our final receipt of the one-time lump-sum payment will result in us incurring approximately $24.6 million in legal fees.
Guarantees and Other
We include indemnification provisions in the contracts we enter with customers and business partners. Generally, these provisions require us to defend claims arising out of our products’ infringement of third-party intellectual property rights, breach of contractual obligations and/or unlawful or otherwise culpable conduct. The indemnity obligations generally cover damages, costs and attorneys’ fees arising out of such claims. In most, but not all cases, our total liability under such provisions is limited to either the value of the contract or a specified, agreed-upon amount. In some cases, our total liability under such provisions is unlimited. In many, but not all cases, the term of the indemnity provision is perpetual. While the maximum potential amount of future payments we could be required to make under all the indemnification provisions is unlimited, we believe the estimated fair value of these provisions is minimal due to the low frequency with which these provisions have been triggered.
We indemnify our directors and officers to the fullest extent permitted by Delaware law, which provides among other things, indemnification to directors and officers for expenses, judgments, fines, penalties and settlement amounts incurred by such persons in their capacity as a director or officer of the Company, regardless of whether the individual is serving in any such capacity at the time the liability or expense is incurred. Additionally, in connection with certain acquisitions, we agreed to indemnify the former officers and members of the boards of directors of those companies, on similar terms as described above, for a period of six years from the acquisition date. In certain cases, we purchase director and officer insurance policies related to these obligations, which fully cover the six-year period. To the extent that we do not purchase a director and officer insurance policy for the full period of any contractual indemnification, and such directors and officers do not have coverage under separate insurance policies, we would be required to pay for costs incurred, if any, as described above.
As of September 30, 2025, our letters of credit in connection with security deposits for facility leases totaled $0.7 million in the aggregate. These letters of credit have various terms and expire during fiscal year 2026 and beyond, while some of the letters of credit may automatically renew based on the terms of the underlying agreements.
14. Pension and Other Post-Retirement Benefits
Defined Contribution Plans
We have established a retirement savings plan under Section 401(k) of the Internal Revenue Code (the “401(k) Plan”). The 401(k) Plan covers substantially all of our U.S. employees who meet minimum age and service requirements, and allows participants to defer a portion of their annual compensation on a pre-tax basis. We match 50 % of employee contributions up to 6 % of eligible salary. We incurred charges for contributions to these 401(k) defined contribution plans of $0.4 million, $0.5 million, and $0.5 million for the fiscal years ended September 30, 2025, 2024 and 2023, respectively.
89
Defined Benefit Pension Plans
We sponsor certain defined benefit pension plans that are offered primarily by our foreign subsidiaries. Many of these plans are required by local regulatory requirements. We may deposit funds for these plans with insurance companies, third party trustees or into government-managed accounts consistent with local regulatory requirements, as applicable.
The total defined benefit plan pension expenses incurred for these plans were $0.7 million, $0.3 million, and $0.5 million for the fiscal years ended September 30, 2025, 2024 and 2023, respectively. Our aggregate projected benefit obligation and aggregate net liability for defined benefit plans as of September 30, 2025 was $12.8 million and $6.2 million, as of September 30, 2024 was $12.2 million and $6.2 million, and as of September 30, 2023 was $11.8 million and $5.5 million, respectively.
For the fiscal year ended September 30, 2024, we recognized a curtailment and settlement benefit of $0.4 million related to restructuring programs.
For the fiscal years ended September 30, 2025, 2024 and 2023, charges for contributions to defined benefit pension plans were not material to the Consolidated Statements of Operations.
15. Relationship with Parent and Related Entities
In connection with the Spin-Off, we entered into several agreements with Nuance that set forth the principal actions taken or to be taken in connection with the Spin-Off and that govern the relationship of the parties following the Spin-Off, including the following:
•Separation and Distribution Agreement: We entered into a Separation and Distribution Agreement with Nuance in advance of the Distribution. The Separation and Distribution Agreement sets forth our agreements with Nuance regarding the principal actions to be taken in connection with the Spin-Off. It also sets forth other agreements that govern aspects of our relationship with Nuance following the Spin-Off.
•Tax Matters Agreement: We entered into a Tax Matters Agreement with Nuance that governs the respective rights, responsibilities and obligations of Nuance and us after the Distribution with respect to all tax matters (including tax liabilities, tax attributes, tax returns and tax contests).
•Transition Services Agreement:We entered into a Transition Services Agreement pursuant to which Nuance will provide us, and we will provide Nuance, with certain specified services for a limited time to help ensure an orderly transition following the Distribution.
•Employee Matters Agreement:We entered into an Employee Matters Agreement with Nuance that addresses employment and employee compensation and benefits matters. The Employee Matters Agreement addresses the allocation and treatment of assets and liabilities relating to employees and compensation and benefit plans and programs in which our employees participated prior to the Spin-Off.
•Intellectual Property Agreement:We entered into an Intellectual Property Agreement with Nuance, pursuant to which we granted to Nuance, and Nuance granted to us, perpetual, non-exclusive, royalty-free licenses to certain patents and technology, as well as certain other intellectual property that have historically been shared between us and Nuance.
•Transitional Trademark License Agreement:We entered into a Transitional Trademark License Agreement with Nuance, pursuant to which Nuance granted us a non-exclusive, royalty free license to continue using certain of Nuance’s trademarks, trade names and service marks with respect to the “Nuance” and “Dragon” brands in connection with the sale, marketing and other commercialization of our products and services.
•OEM and Distribution License Agreements: We entered into four OEM and Distribution License Agreements with Nuance. Under three of the four agreements, Cerence licenses to Nuance designated Cerence technologies for Nuance’s internal use and for distribution to Nuance end-users and resellers. On May 6, 2025, Cerence filed a lawsuit alleging copyright infringement and breach of contract against Nuance and Microsoft related in part to their continued use of Cerence's text-to-speech after the expiration of one of those agreements, which lawsuit is pending. Under the final agreement, Nuance licenses to Cerence designated Nuance
90
technologies for Cerence’s internal use and for distribution to Cerence end-users and resellers. All agreements contain customary commercial terms for arrangements of this nature.
16. Income Taxes
Provision for income taxes
The components of loss before income taxes are as follows (dollars in thousands):
| Year Ended September 30, | |||||||||||||||||
| 2025 | 2024 | 2023 | |||||||||||||||
| Domestic | $ | ( | $ | ( | $ | ( | |||||||||||
| Foreign | ( | ( | |||||||||||||||
| Loss before income taxes | $ | ( | $ | ( | $ | ( | |||||||||||
The components of provision for income taxes are as follows (dollars in thousands):
| Year Ended September 30, | |||||||||||||||||
| 2025 | 2024 | 2023 | |||||||||||||||
| Current: | |||||||||||||||||
| Federal | $ | $ | ( | $ | |||||||||||||
| State | |||||||||||||||||
| Foreign | |||||||||||||||||
| Total current | |||||||||||||||||
| Deferred: | |||||||||||||||||
| Federal | ( | ( | |||||||||||||||
| State | ( | ||||||||||||||||
| Foreign | ( | ( | |||||||||||||||
| Total deferred | ( | ||||||||||||||||
| Provision for income taxes | $ | $ | $ | ||||||||||||||
| Effective income tax rate | ( | % | ( | % | ( | % | |||||||||||
The provision for income taxes differed from the amount computed by applying the federal statutory rate to our loss before income taxes as follows (dollars in thousands):
| Year Ended September 30, | |||||||||||||||||
| 2025 | 2024 | 2023 | |||||||||||||||
| Federal tax provision at statutory rate | $ | ( | $ | ( | $ | ( | |||||||||||
| State tax, net of federal benefit | ( | ||||||||||||||||
| Foreign tax rate and other foreign related tax items | |||||||||||||||||
| Uncertain tax positions | |||||||||||||||||
| Stock-based compensation | |||||||||||||||||
| Global intangible low-taxed income | ( | ||||||||||||||||
| Goodwill impairment | |||||||||||||||||
| Change in valuation allowance | ( | ( | |||||||||||||||
| Executive compensation | |||||||||||||||||
| Non-deductible expenditures | |||||||||||||||||
| R&D credits | ( | ( | ( | ||||||||||||||
| Intangible property transfers | ( | ||||||||||||||||
| Capital losses | |||||||||||||||||
| Enacted changes in tax laws or rates | |||||||||||||||||
| Provision for income taxes | $ | $ | $ | ||||||||||||||
91
The effective income tax rate is based upon the income for the year, the composition of the income in different countries, and adjustments, if any, for the potential tax consequences, benefits or resolutions of audits or other tax contingencies. Our effective tax rate may be adversely affected by earnings being lower than anticipated in countries where we have lower statutory tax rates and higher than anticipated in countries where we have higher statutory tax rates.
Our effective tax rate for the fiscal year 2025 differed from the U.S. federal statutory rate of 21.0 %, primarily due to the tax impacts of stock-based compensation, research credits, and our composition of jurisdictional earnings.
During the fiscal year ended September 30, 2025, we recorded a non-cash out-of-period adjustment of $3.8
Our effective tax rate for the fiscal year 2024 differed from the U.S. federal statutory rate of 21.0 %, primarily due to impairment of book goodwill, the tax impacts of stock-based compensation, U.S. inclusions of foreign taxable income, valuation allowance on foreign loss carryforwards, and our composition of jurisdictional earnings.
The effective tax rate for the fiscal year 2023 differed from the U.S. federal statutory rate of 21.0 %, primarily due to the tax impacts of stock-based compensation, U.S. inclusions of foreign taxable income, valuation allowance on foreign loss carryforwards, and our composition of jurisdictional earnings. The intangible property transfers deferred tax benefit was offset by a change in valuation allowance deferred tax expense.
As of September 30, 2025, we have not provided taxes on undistributed earnings of our foreign subsidiaries, which may be subject to foreign withholding taxes upon repatriation, as we consider these earnings indefinitely reinvested. Our indefinite reinvestment determination is based on the future operational and capital requirements of our domestic and foreign operations. We expect our international cash and cash equivalents and marketable securities will continue to be used for our foreign operations and therefore do not anticipate repatriating these funds. As of September 30, 2025, it is not practical to calculate the unrecognized deferred tax liability on these earnings due to the complexities of the utilization of foreign tax credits and other tax assets.
92
Deferred tax assets (liabilities) consist of the following as of September 30, 2025 and 2024 (dollars in thousands):
| September 30, | |||||||||||
| 2025 | 2024 | ||||||||||
| Deferred tax assets: | |||||||||||
| Net operating loss carryforwards | $ | $ | |||||||||
| Federal credit carryforwards | |||||||||||
| Accrued expenses and other reserves | |||||||||||
| Deferred revenue | |||||||||||
| Acquired intangibles | |||||||||||
| Interest limitations carryforward | |||||||||||
| Operating lease liabilities | |||||||||||
| Depreciation | |||||||||||
| Deferred compensation | |||||||||||
| Pension obligation | |||||||||||
| Other | |||||||||||
| Total deferred tax assets | |||||||||||
| Valuation allowance for deferred tax assets | ( | ( | |||||||||
| Deferred tax assets | $ | $ | |||||||||
| Deferred tax liabilities: | |||||||||||
| Depreciation | $ | ( | $ | ( | |||||||
| Acquired intangibles | ( | ( | |||||||||
| Operating lease right of use assets | ( | ( | |||||||||
| Deferred costs | ( | ( | |||||||||
| Other | ( | ( | |||||||||
| Total deferred tax liabilities | ( | ( | |||||||||
| Net deferred tax assets | $ | $ | |||||||||
Deferred income taxes arise from temporary differences between the tax and financial statement recognition of revenue and expenses. We regularly assess the need for a valuation allowance against our deferred tax assets. In evaluating whether it is more likely than not that some or all of our deferred tax assets will not be realized, we consider all available positive and negative evidence. We maintain a valuation allowance against these deferred tax assets until we believe it is more likely than not that they will be realized. If sufficient positive evidence arises in the future indicating that all or a portion of the deferred tax assets meet the more likely than not standard, the valuation allowance would be reversed accordingly in the period that such determination is made. As of September 30, 2025, we have $151.0 million in valuation allowance against our net foreign deferred tax assets. As of September 30, 2024, we have $167.3 million in valuation allowance against our net foreign deferred tax assets. The change in valuation allowance of $(16.3 ) million included income tax provision of $(23.3 ) million, cumulative translation adjustments of $7.1 million, and other comprehensive income of $(0.1 ) million.
The remaining deferred tax assets after valuation allowances are primarily domestic. For each of the periods shown, we have domestic financial taxable income resulting from permanent differences between domestic loss before income taxes and taxable income. Based on the level of historical financial taxable income and projections for future financial taxable income over the periods for which these deferred tax assets are deductible, we believe that it is more likely than not that we will realize the benefits of the domestic deductible differences.
As of September 30, 2025, we have immaterial U.S. federal net operating loss (“NOL”) carryforwards, we have state NOL carryforwards of $8.3 million, and foreign NOL carryforwards of $453.8 million, before uncertain tax positions of $284.2 million. As of September 30, 2024, we have immaterial U.S. federal net operating loss (“NOL”) carryforwards, state NOL carryforwards of $9.8 million, and foreign NOL carryforwards of $433.6 million, before uncertain tax positions of $270.2 million. These carryforwards will expire at various dates beginning in 2026 and extending up to an unlimited period. As of September 30, 2025 and 2024, unlimited federal NOLs are immaterial and immaterial, respectively, and unlimited Netherlands NOLs are $387.6 million and $360.7 million, respectively.
93
As of September 30, 2025, we have U.S. federal research and development carryforwards and foreign tax credit carryforwards of $4.1 million, before uncertain tax positions of $3.9 million, state research and development credits of $0.5 million, and foreign research and development credits of $9.1 million. As of September 30, 2024, we have U.S. federal research and development carryforwards and foreign tax credit carryforwards of $7.0 million, before uncertain tax positions of $5.2 million, state research and development credits of $0.3 million, and foreign research and development credits of $7.2 million. These carryforwards will expire at various dates beginning in 2026 and extending up to 2042.
Uncertain Tax Positions
ASC 740 prescribes the accounting for uncertainty in income taxes recognized in the financial statements. We regularly assess the outcome of potential examinations in each of the taxing jurisdictions when determining the adequacy of the amount of unrecognized tax benefit recorded. We recognize tax benefits from uncertain tax positions only if it is more likely than not that the tax position will be sustained on examination by the taxing authorities, based on the technical merits of the position. The tax benefits recognized in the financial statements from such positions are then measured based on the largest benefit which is more likely than not to be realized upon ultimate settlement. We recognize interest and penalties related to unrecognized tax positions in our provision for (benefit from) income taxes line of our Consolidated Statements of Operations.
The aggregate changes in the balance of our gross unrecognized tax benefits were as follows (dollars in thousands):
| September 30, | |||||||||||
| 2025 | 2024 | ||||||||||
| Balance at the beginning of the year | $ | $ | |||||||||
| Beginning balance adjustment | |||||||||||
| Increases related to tax positions taken from prior periods | |||||||||||
| Decreases related to tax positions taken from prior periods | ( | ( | |||||||||
| Increases related to tax positions taken during current period | |||||||||||
| Decreases for tax settlements and lapse in statutes | ( | ( | |||||||||
| Balance at the end of the year | $ | $ | |||||||||
As of September 30, 2025 and 2024, beginning balance adjustments include cumulative translation adjustments of $3.2 million and $4.0 million, respectively.
As of September 30, 2025, $89.3 million of the unrecognized tax benefits, if recognized, would impact our effective tax rate. We do not expect a significant change in the amount of unrecognized tax benefits within the next 12 months. We recognized interest related to uncertain tax positions in our provision for (benefit from) income taxes of $1.3 million, $1.3 million and $0.6 million during fiscal years 2025, 2024 and 2023 respectively. We recorded interest of $6.3 million and $5.6 million as of September 30, 2025 and 2024, respectively.
On July 4, 2025, the One Big Beautiful Bill Act (the "Act") was signed into law. Certain provisions of the Act were applicable to us beginning in 2025 while other provisions will become effective beginning in fiscal 2026 and 2027. The impact of the Act is not material to our year ended September 30, 2025 consolidated financial statements. We continue to evaluate the future impact of these tax law changes.
We are subject to U.S. federal income tax, various state and local taxes and international income taxes in numerous jurisdictions. The 2016 through 2024 tax years remain open for all purposes of examination by the IRS and other taxing authorities in material jurisdictions.
17. Long-Term Debt
Long-term debt consisted of the following (in thousands):
94
| September 30, 2025 | ||||||||||||||||||||||||||||||||||||||||||||
| Description | Maturity Date | Convertible Debt Coupon Rate | Effective Interest Rate | Principal | Unamortized Discount | Deferred Issuance Costs | Carrying Value | |||||||||||||||||||||||||||||||||||||
| 2025 Modified Notes | 7/1/2028 | ( | ( | |||||||||||||||||||||||||||||||||||||||||
| 2028 Notes | 7/1/2028 | ( | ||||||||||||||||||||||||||||||||||||||||||
| Total debt | $ | $ | ( | $ | ( | |||||||||||||||||||||||||||||||||||||||
| Less: current portion of long-term debt | ||||||||||||||||||||||||||||||||||||||||||||
| Total long-term debt | $ | |||||||||||||||||||||||||||||||||||||||||||
| September 30, 2024 | ||||||||||||||||||||||||||||||||||||||||||||
| Description | Maturity Date | Convertible Debt Coupon Rate | Effective Interest Rate | Principal | Unamortized Discount | Deferred Issuance Costs | Carrying Value | |||||||||||||||||||||||||||||||||||||
| 2025 Modified Notes | 6/1/2025 | $ | $ | $ | ( | $ | ||||||||||||||||||||||||||||||||||||||
| 2025 Modified Notes | 7/1/2028 | ( | ( | |||||||||||||||||||||||||||||||||||||||||
| 2028 Notes | 7/1/2028 | ( | ||||||||||||||||||||||||||||||||||||||||||
| Total debt | $ | $ | ( | $ | ( | |||||||||||||||||||||||||||||||||||||||
| Less: current portion of long-term debt | ( | |||||||||||||||||||||||||||||||||||||||||||
| Total long-term debt | $ | |||||||||||||||||||||||||||||||||||||||||||
The following table summarizes the maturities of our borrowing obligations as of September 30, 2025 (in thousands):
| Fiscal Year | 2028 Notes | 2025 Modified Notes | Total | |||||||||||||||||
| 2026 | $ | $ | $ | |||||||||||||||||
| 2027 | ||||||||||||||||||||
| 2028 | ||||||||||||||||||||
| 2029 | ||||||||||||||||||||
| 2030 | ||||||||||||||||||||
| Thereafter | ||||||||||||||||||||
| Total before unamortized discount and issuance costs and current portion | $ | $ | $ | |||||||||||||||||
| Less: unamortized discount and issuance costs | ( | ( | ( | |||||||||||||||||
| Less: current portion of long-term debt | ||||||||||||||||||||
| Total long-term debt | $ | $ | $ | |||||||||||||||||
On June 26, 2023, we issued $190.0 million in aggregate principal amount of 1.50 % Convertible Senior Notes due 2028 (the “2028 Notes”), which are governed by an indenture (the “2028 Indenture”), between us and U.S. Bank Trust Company, National Association, as trustee (the “Trustee”), in a private offering to qualified institutional buyers pursuant to Rule 144A under the Securities Act of 1933, as amended (the “Securities Act”). On July 3, 2023, we issued an additional $20.0 million in aggregate principal amount of 2028 Notes. The net proceeds from the issuance of the 2028 Notes were $193.2 million after deducting transaction costs.
The 2028 Notes are senior, unsecured obligations and accrue interest payable semiannually in arrears on January 1 and July 1 of each year at a rate of 1.50 % per year. The 2028 Notes will mature on July 1, 2028, unless earlier converted, redeemed, or repurchased. The 2028 Notes are convertible into cash, shares of our common stock or a combination of cash and shares of our common stock, at our election.
95
A holder of 2028 Notes may convert all or any portion of its 2028 Notes at its option at any time prior to the close of business on the business day immediately preceding April 3, 2028 only under the following circumstances: (1) during any fiscal quarter commencing after the fiscal quarter ending on September 30, 2023 (and only during such fiscal quarter), if the last reported sale price of our common stock for at least 20 trading days (whether or not consecutive) during a period of 30 consecutive trading days ending on, and including, the last trading day of the immediately preceding fiscal quarter is greater than or equal to 130 % of the conversion price on each applicable trading day; (2) during the five business day period after any ten consecutive trading day period (the “measurement period”) in which the “trading price” (as defined in the 2028 Indenture) per $1,000 principal amount of 2028 Notes for each trading day of the measurement period was less than 98 % of the product of the last reported sale price of our common stock and the conversion rate on each such trading day; (3) if we call such 2028 Notes for redemption, at any time prior to the close of business on the business day immediately preceding the redemption date; or (4) upon the occurrence of specified corporate events. On or after April 3, 2028 until the close of business on the second scheduled trading day immediately preceding the maturity date, a holder may convert all or any portion of its 2028 Notes at any time, regardless of the foregoing circumstances.
The conversion rate is 24.5586 shares of our common stock per $1,000 principal amount of 2028 Notes (equivalent to an initial conversion price of approximately $40.72 per share of our common stock). The conversion rate is subject to adjustment in some events but will not be adjusted for any accrued and unpaid interest. In addition, following certain corporate events that occur prior to the maturity date or if we deliver a notice of redemption, we will, in certain circumstances, increase the conversion rate for a holder who elects to convert its 2028 Notes in connection with such a corporate event or convert its 2028 Notes called for redemption in connection with such notice of redemption, as the case may be.
We may not redeem the 2028 Notes prior to July 6, 2026. We may redeem for cash all or any portion of the 2028 Notes (subject to certain limitations), at our option, on a redemption date occurring on or after July 6, 2026 and on or before the 31st scheduled trading day immediately before the maturity date, if the last reported sale price of our common stock has been at least 130 % of the conversion price then in effect for at least 20 trading days (whether or not consecutive), including the trading day immediately preceding the date on which we provide notice of redemption, during any 30 consecutive trading day period ending on, and including, the trading day immediately preceding the date on which we provide notice of redemption at a redemption price equal to 100 % of the principal amount of the notes to be redeemed, plus accrued and unpaid interest to, but excluding, the redemption date. No sinking fund is provided for the 2028 Notes.
If we undergo a “fundamental change”, subject to certain conditions, holders may require us to repurchase for cash all or any portion of their 2028 Notes at a fundamental change repurchase price equal to 100 % of the principal amount of the 2028 Notes to be repurchased, plus any accrued and unpaid interest to, but excluding, the fundamental change repurchase date.
The 2028 Indenture contains customary terms and covenants, including that upon certain events of default occurring and continuing, either the Trustee or the holders of not less than 25 % in aggregate principal amount of the 2028 Notes then outstanding may declare the entire principal amount of all the 2028 Notes plus accrued special interest, if any, to be immediately due and payable.
In connection with the offering of the 2028 Notes, we repurchased $87.5 million in aggregate principal amount of the 2025 Notes in a privately negotiated transaction. We specifically negotiated the repurchase of the 2025 Notes with investors who concurrently purchased the 2028 Notes. We evaluated the transaction to determine whether the exchange should be accounted for as a modification or extinguishment under the provisions of ASC 470-50, which allows for an exchange of debt instruments between the same debtor and creditor to be accounted for as a modification so long as the instruments do not have substantially different terms. Because the concurrent redemption of the 2025 Notes and a portion of issuance of the 2028 Notes were executed with the same investors, we evaluated the transaction as a debt modification, on a creditor by creditor basis. The repurchase of the 2025 Notes and issuance of the 2028 Notes were deemed to not have substantially different terms on the basis that (1) the present value of the cash flows under the terms of the new debt instrument were less than 10 % different from the present value of the remaining cash flows under the terms of the original instrument and (2) the fair value of the conversion feature did not change by more than 10 % of the carrying value of the 2025 Notes, and therefore, the repurchase of the 2025 Notes was accounted for as a debt modification.
As a result, $87.5 million of the 2028 Notes are considered a modification of the 2025 Notes and are included in the balances of the 2025 Notes (the “2025 Modified Notes” and together with the 2028 Notes, the “Notes”) that were not repurchased as part of the transaction. We recorded $14.3 million of fees paid directly to the lenders as deferred debt issuance costs, and $3.8 million of fees paid to third-parties were expensed in the period. As of September 30, 2025, the carrying amount of the 2025 Modified Notes was $78.5 million, net of unamortized costs of $9.0 million.
If a convertible debt instrument is modified or exchanged in a transaction that is not accounted for as an extinguishment, an increase in the fair value of the embedded conversion option shall reduce the carrying amount of the
96
debt instrument with a corresponding increase in Additional paid-in capital. We recognized the increase in the fair value of the embedded conversion feature of $4.1 million as Additional paid-in capital and an equivalent discount that reduced the carrying value of the 2025 Modified Notes.
We accounted for $122.5 million of the 2028 Notes that were not negotiated with the investors of the 2025 Notes, as a single liability. We incurred transaction costs of $2.4 million relating to the issuance of the 2028 Notes, which were recorded as a direct deduction from the face amount of the 2028 Notes and are being amortized as interest expense over the term of the 2028 Notes using the interest method. As of September 30, 2025, the carrying amount of the 2028 Notes was $121.2 million and unamortized issuance costs of $1.3 million. As of September 30, 2025 and September 30, 2024, the if-converted value of the 2028 Notes was $85.0 million and $113.0 million, respectively, less than its principal amount.
The conditional conversion feature of the 2028 Notes was not triggered during the fiscal year ended September 30, 2025. As of September 30, 2025, the 2028 Notes were not convertible. As of the date of this report, no 2028 Notes have been converted by the holders. Whether any of the 2028 Notes will be converted in future quarters will depend on the satisfaction of one or more of the conversion conditions in the future. If one or more holders elect to convert their 2028 Notes at a time when any such 2028 Notes are convertible, unless we elect to satisfy our conversion obligation by delivering solely shares of our common stock (other than paying cash in lieu of delivering any fractional shares), we would be required to settle a portion or all of our conversion obligation through the payment of cash, which could adversely affect our liquidity.
On June 2, 2020, we issued $175.0 million in aggregate principal amount of 3.00 % Convertible Senior Notes due 2025 (the “2025 Notes”), including the initial purchasers’ exercise in full of their option to purchase $25.0 million principal amount of the 2025 Notes, which are governed by an indenture (the “2025 Indenture”), between us and the Trustee, in a private offering to qualified institutional buyers pursuant to Rule 144A under the Securities Act of 1933, as amended. The net proceeds from the issuance of the 2025 Notes were $169.8 million after deducting transaction costs.
The 2025 Notes were senior, unsecured obligations and accrued interest payable semiannually in arrears on June 1 and December 1 of each year, at a rate of 3.00 % per year.
During the year ended September 30, 2025, we repurchased $27.4 million aggregate principal amount of our 2025 Notes for $27.0 million in cash, including accrued interest and fees, via privately negotiated transactions with certain holders. The repurchased 2025 Notes were subsequently cancelled and retired, resulting in a gain on extinguishment of debt of $0.3 million. The remaining outstanding principal balance on the 2025 Notes and accrued interest of $61.0 million was repaid in its entirety at maturity during the three months ended June 30, 2025.
The interest expense recognized related to the Notes for the fiscal years ended September 30, 2025, 2024 and 2023 were as follows (dollars in thousands):
| Year Ended September 30, | |||||||||||||||||
| 2025 | 2024 | 2023 | |||||||||||||||
| Contractual interest expense | $ | $ | $ | ||||||||||||||
| Amortization of debt discount | |||||||||||||||||
| Amortization of issuance costs | |||||||||||||||||
| Total interest expense related to the Notes | $ | $ | $ | ||||||||||||||
Senior Credit Facilities
On June 12, 2020 (the “Financing Closing Date”), we entered into a Credit Agreement, by and among the Borrower, the lenders and issuing banks party thereto and Wells Fargo Bank, N.A., as administrative agent (the “Credit Agreement”), consisting of a four-year senior secured term loan facility in the aggregate principal amount of $125.0 million (the “Term Loan Facility”). The net proceeds from the issuance of the Term Loan Facility were $123.0 million. We also entered into a senior secured first-lien revolving credit facility in an aggregate principal amount of $50.0 million (the “Revolving Facility” and, together with the Term Loan Facility, the “Senior Credit Facilities”), which may be drawn on in the event that our working capital and other cash needs are not supported by our operating cash flow.
97
In connection with the issuance of the 2028 Notes, in the third quarter of fiscal year 2023, we borrowed $24.7 million under our Revolving Facility and paid $106.3 million towards our Term Loan Facility. As a result, we recorded $104.9 million extinguishment of debt and $1.3 million loss on the extinguishment of debt. All principal and interest on the Term Loan Facility have been paid in full. As of September 30, 2025 and September 30, 2024, there were no
On December 31, 2024, we terminated the Credit Agreement. On the date of termination, there were no revolving loans outstanding under the Credit Agreement. As a result of the Credit Agreement termination, we will not have access to the Revolving Facility and we will not be subject to the applicable Credit Agreement covenants.
Total interest expense relating to the Senior Credit Facilities for the fiscal years ended September 30, 2025, 2024 and 2023 were $0.4 million, $0.4 million, $6.7 million, respectively, reflecting the coupon and accretion of the discount.
18. Subsequent Events
In preparing the consolidated financial statements, management has evaluated subsequent events through the date of filing of this report on Form 10-K for recognition and/or disclosure purposes. Based on this evaluation, we have determined that there were no events that have occurred that require recognition or disclosure, other than certain events and transactions that have been disclosed elsewhere in these consolidated financial statements.
98
Item 9. Changes in and Disagreements with Accountants on Accounting and Financial Disclosure.
Not Applicable.
Item 9A. Controls and Procedures.
Evaluation of disclosure controls and procedures. Based on the evaluation of our disclosure controls and procedures (as defined in Rules 13a-15(e) and 15d-15(e) under the Exchange Act required by Exchange Act Rules 13a-15(b) or 15d-15(b), our principal executive officer (our Chief Executive Officer) and principal financial officer (our Chief Financial Officer) have concluded that as of the end of the period covered by this report, our disclosure controls and procedures were effective to ensure that information required to be disclosed by Cerence in reports that it files or submits under the Exchange Act is recorded, processed, summarized and reported within the time periods specified in SEC rules and forms, and include controls and procedures designed to ensure that information required to be disclosed by us in such reports is accumulated and communicated to our management, including the principal executive officer and principal financial officer, as appropriate, to allow timely decisions regarding required disclosure.
Management report on internal control over financial reporting. Management is responsible for establishing and maintaining adequate internal control over financial reporting, as defined in Rules 13a-15(f) and 15d-15(f) under the Exchange Act. Our internal control over financial reporting is designed to provide reasonable assurance regarding the reliability of financial reporting and the preparation of financial statements for external reporting purposes in accordance with generally accepted accounting principles and include those policies and procedures that:
•Pertain to the maintenance of records that in reasonable detail accurately and fairly reflect the transactions and disposals of the assets of the Company;
•Provide reasonable assurance that transactions are recorded as necessary to permit preparation of financial statements in accordance with generally accepted accounting principles, and that receipts and expenditures of the Company are being made only in accordance with authorizations of management and directors of the Company; and
•Provide reasonable assurance regarding prevention or timely detection of unauthorized acquisition, use or disposition of the Company’s assets that could have a material effect on the financial statements.
Because of its inherent limitations, internal control over financial reporting may not prevent or detect all misstatements and all fraud. Therefore, even those systems determined to be effective can provide only reasonable, not absolute, assurance with respect to financial statement preparation and presentation. Projections of any evaluation of effectiveness to future periods are subject to the risk that controls may become inadequate because of changes in conditions and that the degree of compliance with the policies or procedures may deteriorate.
Management, under the supervision of the Chief Executive Officer and Chief Financial Officer, has assessed the effectiveness of our internal control over financial reporting as of September 30, 2025, utilizing the criteria set forth by the Committee of Sponsoring Organizations of the Treadway Commission (“COSO”) in the 2013 Internal Control-Integrated Framework. Based on the results of this assessment, management (including our Chief Executive Officer and our Chief Financial Officer) has concluded that, as of September 30, 2025, our internal control over financial reporting was effective based on those criteria.
The attestation report concerning the effectiveness of our internal control over financial reporting as of September 30, 2025 issued by BDO USA, P.C., an independent registered public accounting firm, appears in Item 8 of this Annual Report on Form 10-K.
Changes in internal control over financial reporting. There were no changes in our internal control over financial reporting during the three months ended September 30, 2025 that have materially affected, or are reasonably likely to materially affect, our internal control over financial reporting.
Item 9B. Other Information.
Rule 10b5-1 Plans.Our policy governing transactions in our securities by directors, officers and employees permits our officers, directors and certain other persons to enter into trading plans complying with Rule 10b5-1 under the Exchange Act. Generally, under these trading plans, the individual relinquishes control over the transactions once the trading plan is put into place. Accordingly, sales under these plans may occur at any time, including possibly before, simultaneously with, or immediately after significant events involving our company.
99
During the three-month period ending September 30, 2025, none
We anticipate that, as permitted by Rule 10b5-1 and our policy governing transactions in our securities, some or all of our officers, directors and employees may establish trading plans in the future. We intend to disclose the names of executive officers and directors who establish a trading plan in compliance with Rule 10b5-1 and Regulation S-K, Item 408(a) and the requirements of our policy governing transactions in our securities in our future quarterly and annual reports on Form 10-Q and 10-K filed with the Securities and Exchange Commission. However, we undertake no obligation to update or revise the information provided herein, including for revision or termination of an established trading plan, other than in such quarterly and annual reports.
Item 9C. Disclosure Regarding Foreign Jurisdictions that Prevent Inspections.
Not Applicable.
100
PART III
Item 10. Directors, Executive Officers and Corporate Governance.
Our Board of Directors adopted a Code of Business Conduct and Ethics for all of our directors, officers and employees on October 2, 2019. Our Code of Business Conduct and Ethics can be found at our website: www.cerence.com/governance/governance-documents. We will provide to any person without charge, upon request, a copy of our Code of Business Conduct and Ethics. Such a request should be made in writing and addressed to Investor Relations, Cerence Inc., 25 Mall Road, Suite 416, Burlington, MA 01803.
To date, there have been no waivers under our Code of Business Conduct and Ethics that apply to our principal executive officer, principal financial officer, principal accounting officer and controller, or persons performing similar functions. We will post any waivers, if and when granted, of our Code of Business Conduct and Ethics on our website at www.cerence.com/governance/governance-documents.
The Company has an insider trading policy governing the purchase, sale and other dispositions of the Company’s securities that applies to all Company personnel, including directors, officers, employees, and other designated persons. The Company believes that its insider trading policy is reasonably designed to promote compliance with insider trading laws, rules and regulations, and NASDAQ listing standards when engaging in transactions in company securities. A copy of the Company’s insider trading policy is filed as Exhibit 19.1 to this report. The Company does not currently have a stock repurchase program.
The additional information required by this Item for the Company will be set forth in the Company’s Proxy Statement for the 2026 Annual Meeting of Stockholders, which information is hereby incorporated by reference.
Item 11. Executive Compensation.
The information required by this Item for the Company will be set forth in the Company’s Proxy Statement for the 2026 Annual Meeting of Stockholders, which information is hereby incorporated herein by reference.
Item 12. Security Ownership of Certain Beneficial Owners and Management and Related Stockholder Matters.
The information required by this Item for the Company will be set forth in Company’s Proxy Statement for the 2026 Annual Meeting of Stockholders, which information is hereby incorporated herein by reference.
Item 13. Certain Relationships and Related Transactions, and Director Independence.
The information required by this Item for the Company will be set forth in the Company’s Proxy Statement for the 2026 Annual Meeting of Stockholders, which information is hereby incorporated herein by reference.
Item 14. Principal Accounting Fees and Services.
The information required by this Item for the Company will be set forth in Company’s Proxy Statement for the 2026 Annual Meeting of Stockholders, which information is hereby incorporated herein by reference.
101
PART IV
Item 15. Exhibits, Financial Statement Schedules.
(a)The following documents are filed as a part of this Report:
(2)Financial Statement Schedules — All schedules have been omitted as the requested information is inapplicable or the information is presented in the financial statements or related notes included as part of this Report.
(3)Exhibits — See Item 15(b) of this Report below.
(b)Exhibits.
EXHIBIT INDEX
| Incorporated by Reference | ||||||||||||||||||||||||||||||||||||||
| Exhibit Index # | Exhibit Description | Filed Herewith | Form | File No. | Exhibit | Filing Date | ||||||||||||||||||||||||||||||||
| 2.1 | 8-K | 001-39030 | 2.1 | October 2, 2019 | ||||||||||||||||||||||||||||||||||
| 3.1 | 8-K | 001-39030 | 3.1 | October 2, 2019 | ||||||||||||||||||||||||||||||||||
| 3.2 | 8-K | 001-39030 | 3.1 | May 4, 2023 | ||||||||||||||||||||||||||||||||||
| 3.3 | 10-Q | 001-39030 | 3.3 | May 7, 2025 | ||||||||||||||||||||||||||||||||||
| 4.1 | 8-K | 001-39030 | 4.1 | June 2, 2020 | ||||||||||||||||||||||||||||||||||
| 4.2 | 8-K | 001-39030 | 4.1 | June 2, 2020 | ||||||||||||||||||||||||||||||||||
| 4.3 | 10-K | 001-39030 | 4.3 | November 29, 2023 | ||||||||||||||||||||||||||||||||||
| 4.4 | 8-K | 001-39030 | 4.1 | June 26, 2023 | ||||||||||||||||||||||||||||||||||
| 4.5 | 8-K | 001-39030 | 4.1 | June 26. 2023 | ||||||||||||||||||||||||||||||||||
| 10.1 | 8-K | 001-39030 | 10.1 | October 2, 2019 | ||||||||||||||||||||||||||||||||||
| 10.2 | 8-K | 001-39030 | 10.2 | October 2, 2019 | ||||||||||||||||||||||||||||||||||
| 10.3 | 8-K | 001-39030 | 10.3 | October 2, 2019 | ||||||||||||||||||||||||||||||||||
| 10.4 | 8-K | 001-39030 | 10.4 | October 2, 2019 | ||||||||||||||||||||||||||||||||||
102
| 10.5 | 8-K | 001-39030 | 10.5 | October 2, 2019 | ||||||||||||||||||||||||||||||||||
| 10.6† | S-8 | 333-234040 | 4.3 | October 2, 2019 | ||||||||||||||||||||||||||||||||||
| 10.7† | S-8 | 333-234040 | 4.6 | October 2, 2019 | ||||||||||||||||||||||||||||||||||
| 10.8† | 10-K | 001-39030 | 10.14 | December 19, 2020 | ||||||||||||||||||||||||||||||||||
| 10.9 | 10-Q | 001-39030 | 10.4 | May 10, 2024 | ||||||||||||||||||||||||||||||||||
| 10.10† | 10-K | 001-39030 | 10.13 | November 19, 2020 | ||||||||||||||||||||||||||||||||||
| 10.11† | 10-K | 001-39030 | 10.14 | November 19, 2020 | ||||||||||||||||||||||||||||||||||
| 10.12 | 8-K | 001-39030 | 10.1 | June 17, 2020 | ||||||||||||||||||||||||||||||||||
| 10.13 | 8-K | 001-39030 | 10.2 | June 17, 2020 | ||||||||||||||||||||||||||||||||||
| 10.14 | 8-K | 001-39030 | 10.3 | June 17, 2020 | ||||||||||||||||||||||||||||||||||
| 10.15† | 10-K | 001-39030 | 10.18 | November 19, 2020 | ||||||||||||||||||||||||||||||||||
| 10.16 | 8-K | 001-39030 | 10.1 | December 21, 2020 | ||||||||||||||||||||||||||||||||||
| 10.17† | 8-K | 001-39030 | 10.1 | December 15, 2021 | ||||||||||||||||||||||||||||||||||
| 10.18† | 8-K | 001-39030 | 10.1 | June 24, 2022 | ||||||||||||||||||||||||||||||||||
| 10.19† | 8-K | 001-39030 | 10.2 | June 24, 2022 | ||||||||||||||||||||||||||||||||||
| 10.20 | 10-K | 001-39030 | 10.31 | November 29, 2022 | ||||||||||||||||||||||||||||||||||
| 10.21† | 8-K | 001-39030 | 10.1 | March 4, 2024 | ||||||||||||||||||||||||||||||||||
| 10.22** | 8-K | 001-39030 | 10.1 | April 15, 2024 | ||||||||||||||||||||||||||||||||||
103
| 10.23†** | 10-Q | 001-39030 | 10.2 | August 9, 2024 | ||||||||||||||||||||||||||||||||||
| 10.24† | 8-K | 001-39030 | 10.1 | October 6, 2024 | ||||||||||||||||||||||||||||||||||
| 10.25† | 8-K | 001-39030 | 10.2 | October 6, 2024 | ||||||||||||||||||||||||||||||||||
| 10.26† | 8-K | 001-39030 | 10.3 | October 6, 2024 | ||||||||||||||||||||||||||||||||||
| 10.27† | 10-K | 001-39030 | 10.34 | November 25, 2024 | ||||||||||||||||||||||||||||||||||
| 10.28† | 10-K | 001-39030 | 10.35 | November 25, 2024 | ||||||||||||||||||||||||||||||||||
| 10.29† | 10-Q | 001-39030 | 10.1 | February 6, 2025 | ||||||||||||||||||||||||||||||||||
| 10.30† | 8-K | 001-39030 | 10.1 | December 3, 2024 | ||||||||||||||||||||||||||||||||||
| 10.31† | 8-K | 001-39030 | 10.2 | December 3, 2024 | ||||||||||||||||||||||||||||||||||
| 10.32† | 8-K | 001-39030 | 10.3 | December 3, 2024 | ||||||||||||||||||||||||||||||||||
| 10.33† | 10-Q | 001-39030 | 10.7 | February 6, 2025 | ||||||||||||||||||||||||||||||||||
| 10.34† | 10-Q | 001-39030 | 10.8 | February 6, 2025 | ||||||||||||||||||||||||||||||||||
| 10.35† | X | |||||||||||||||||||||||||||||||||||||
| 19.1 | X | |||||||||||||||||||||||||||||||||||||
| 21.1 | X | |||||||||||||||||||||||||||||||||||||
| 23.1 | X | |||||||||||||||||||||||||||||||||||||
| 24.1 | X | |||||||||||||||||||||||||||||||||||||
| 31.1 | X | |||||||||||||||||||||||||||||||||||||
| 31.2 | X | |||||||||||||||||||||||||||||||||||||
| 32.1* | X | |||||||||||||||||||||||||||||||||||||
104
| 32.2* | X | |||||||||||||||||||||||||||||||||||||
| 97.1 | X | |||||||||||||||||||||||||||||||||||||
| 101.INS | Inline XBRL Instance Document | X | ||||||||||||||||||||||||||||||||||||
| 101.SCH | Inline XBRL Taxonomy Extension Schema Document. | X | ||||||||||||||||||||||||||||||||||||
| 104 | Cover Page Interactive Data File (formatted as Inline XBRL with applicable taxonomy extension information contained in Exhibits 101.*) | X | ||||||||||||||||||||||||||||||||||||
†Management contract or compensatory plan or arrangement
*Furnished herewith.
**Certain schedules and similar attachments have been omitted. The Company agrees to furnish a supplemental copy of any omitted schedule or attachment to the Securities and Exchange Commission upon request.
Item 16. Form 10-K Summary
None.
105
SIGNATURES
Pursuant to the requirements of Section 13 or 15(d) of the Securities Exchange Act of 1934, as amended, the Registrant has duly caused this Report to be signed on its behalf by the undersigned, thereunto duly authorized.
| CERENCE INC. | ||||||||
Date: November 20, 2025 | By: | /s/ Brian Krzanich | ||||||
| Brian Krzanich | ||||||||
Chief Executive Officer (Principal Executive Officer) | ||||||||
POWER OF ATTORNEY
KNOW ALL PERSONS BY THESE PRESENTS, that each individual whose signature appears below constitutes and appoints each of Brian Krzanich and Tony Rodriquez, acting singly, his true and lawful agent, proxy and attorneys-in-fact, each with full power of substitution and resubstitution, for him and in his name, place and stead, in any and all capacities, to sign any and all amendments to this Annual Report on Form 10-K and to file the same with all exhibits thereto, and all documents in connection therewith, with the Securities and Exchange Commission, granting unto said attorneys-in-fact and agents, and each of them, full power and authority to do and perform each and every act and thing requisite and necessary to be done, as fully to all intents and purposes as he might or could do in person, and hereby ratifying and confirming all that said attorneys-in-fact and agents or any of them, or their or his substitute or substitutes, may lawfully do or cause to be done by virtue hereof. This power of attorney may be executed in counterparts.
Pursuant to the requirements of the Securities Exchange Act of 1934, this Report has been signed below by the following persons on behalf of the Registrant and in the capacities and on the dates indicated.
| Name | Title | Date | ||||||||||||
| /s/ Brian Krzanich | Chief Executive Officer and Director | November 20, 2025 | ||||||||||||
| Brian Krzanich | (Principal Executive Officer) | |||||||||||||
| /s/ Tony Rodriquez | Chief Financial Officer | November 20, 2025 | ||||||||||||
| Tony Rodriquez | (Principal Financial and Accounting Officer) | |||||||||||||
| /s/ Kristi Ann Matus | Chairperson of the Board | November 20, 2025 | ||||||||||||
| Kristi Ann Matus | ||||||||||||||
| /s/ Marianne Budnik | Director | November 20, 2025 | ||||||||||||
| Marianne Budnik | ||||||||||||||
| /s/ Doug Davis | Director | November 20, 2025 | ||||||||||||
| Doug Davis | ||||||||||||||
| /s/ Marion Harris | Director | November 20, 2025 | ||||||||||||
| Marion Harris | ||||||||||||||
| /s/ Marcy Klevorn | Director | November 20, 2025 | ||||||||||||
| Marcy Klevorn | ||||||||||||||
| /s/ Alfred Nietzel | Director | November 20, 2025 | ||||||||||||
| Alfred Nietzel | ||||||||||||||
| /s/ Arun Sarin | Director | November 20, 2025 | ||||||||||||
| Arun Sarin | ||||||||||||||
106